
Social media marketing is creative, exhilarating, and colorful. Social media reporting just isn’t, right?
If you dread monthly reports, you’re not alone. Social media managers around the world agree that social media reporting is one of the most tedious and time-consuming aspects of their job.
After you read this guide and learn more about Power Reports, you’ll start seeing client reporting in a new (dare we say “fun”?) light.
You’ll get all the details, tips, and help you need to regularly create and share engaging, informative, and powerful social media reports.
Why Client Reporting Can Feel Agonizing
In the old days, social media reporting involved spreadsheets, CSV files, sticky notes with various numbers written down, and a dozen empty coffee cups on your desk. You ended up creating and designing PowerPoints and swearing loudly that you’re not a designer!
Once that whole process is finally over, you’re sending emails to clients with numerous sheets attached … and invariably, you get no response.
Why the lack of response? Maybe your clients found them as boring to read as you found them to create. Or perhaps your agency clients didn’t understand them at all.
Creating social media reports was a frustrating, time-consuming and (quite frankly) fruitless exercise. In fact, 31% of marketers spend up to 10 hours on reports, compared to the 4 hours outlined as industry normal.
But can you skip social reporting entirely?
No. Not really.
After all, client reporting has myriad benefits for agencies.
Why Agencies Should Do Client Reporting
Let’s run through a quick checklist of reporting benefits.
Social media reporting checklist
Demonstrate ROI to your clients
Establish trust by proving your work
Benchmark key stats like account growth
Gauge the impact of your efforts
Understand audience demographics
Get content and design direction
Assess your community management
Know the best times to publish
Keep your clients coming back for more
Whether you’re presenting analytics to your boss, team, or your agency’s clients, one thing’s for sure: Pulling accurate reporting metrics is key to getting a complete picture of your performance.
Know what social media metrics matter
That means it’s key to keeping clients happy and coming back for more.
Our Agency Playbook: Step-by-Step Guide to Power Reports is going to help you get to reporting Utopia (without the swearing and excess coffee). We’re going to walk you through social reporting with some tips, shortcuts, and reporting wisdom.
Let’s do this!
Reporting: Client Expectations vs Reality
In regards to reporting, there are pain points for clients and agencies alike.
Largely, that friction comes down to a disconnect between the report we provide and the report that the client wants to receive. Sometimes, visualizing your clients’ expectations vs. the reality you’re providing can help you see exactly what they need.
See whether you recognize any of these clients.
Mr. “What’s My ROI?”
Mr. “What’s my ROI?” doesn’t really care about followers, impressions, retweets and shares.
He cares about the ROI (return on investment). He wants to know that the money he’s paying to your agency—plus the cost of social media advertising, designs, and videos—is worth it.
Mr. ROI wants to see the CTR (click-through rate) for posts, so he can compare it with registrations or leads in his Analytics account.
How much did those new customers spend? What is their LTV (lifetime value)? Those are some of the questions he has when reading your colorful social media charts.
Mr. “Cut the Jargon”
Mr. “Cut the Jargon” doesn’t want to hear your fancy marketing buzzwords. In fact, he’s sick of them because he doesn’t really understand them. (He wants simple, straightforward talk.)
And why should he know all the buzzwords? He pays a marketing agency. To him, you’re just showing off by cramming in impressive buzzwords and pages of data. He doesn’t understand all that jargon, and he’s too busy to unpick what you actually mean.
Plus, he has to explain your social media report to other people in the organization—and they won’t understand it either. What a waste of time!
Miss “I Don’t Have Time to Read”
This is a busy woman. She’s running the entire marketing department for a large company and has multiple reports to read, meetings to attend and decisions to make.
The highlight of her day is the delivery of a frothy latte, and salmon and cream cheese sandwich that she will eat at her desk because she’s behind on everything.
She doesn’t want to read pages and pages of rambling reports from you. She just wants some stand-out figures, learning lessons, budget-spend recommendations, and next actions.
She needs to understand exactly what you’re doing without her having to invest hours of time into reading your reports.
Mr. “Where on Earth Is Last Month’s Report?”
Mr. “Where on Earth Is Last Month’s Report?” is a creature of habit. He doesn’t like receiving reports at different times of the month or for unequal timeframes.
When you started your client reporting, you sent him reports for each month at the end of the month, and he loved it. Now you send them mid-month, at the start of the month … and they are all for different timeframes.
How can he compare his performance when he doesn’t have regular reporting? The answer is he can’t.
He also needs to pass this reporting onto other people, so all this just makes him look rather silly. Which he doesn’t like at all.
Miss “What Next?”
Miss “What Next?” wants to know how she should divert her social media marketing budget and resources for the next month. Should she get more GIFs made? Or perhaps Instagram Stories are performing best?
She read your social media report, but she can’t see that information anywhere. Ideally, she wants highlighted sections that show best performing content and some recommendations. She doesn’t want to keep asking you and tries to work it all out for herself … but it isn’t very clear.
All this leaves Miss “What Next?” feeling lost and a bit dubious about her decision to hire a marketing agency.
Mrs. “What Does That Have To Do With Our KPIs?”
Mrs What Does That Have To Do With Our KPIs? thinks you’ve not been paying attention at any of their meetings. They clearly told you at the start what their KPIs (Key Performance Indicators) are.
So, why is there no mention of them in the report or your cover email? She needs to be able to follow the link between goals and actions.
But where are they? These reports won’t stack up when she has a meeting with the shareholders and they demand to know what all the social media marketing is doing for the company.
Do you have these types of clients?
Meet Agorapulse Power Reports
So, here’s what we learned so far:
Social reports take far too long to produce.
Clients are not happy with traditional reporting.
Social media reporting makes us sad.
Enter Power Reports
Agorapulse’s Power Reports are the ultimate smart tool for social media marketers. They are fully automated, give you tons of reporting options, and can combine reports on multiple channels if you want them to.
Example of when you need Power Reports: You’re a marketing agency looking after Facebook, Instagram, LinkedIn, and Twitter marketing for your clients. With a few clicks, you can produce a good-looking report that features stats from all the channels in one hit!
Let’s dig in and discover how easy it is to create a Power Report.
Access Power Reports
To access your Power Report options, click Create A Report tab on the top left side of your dashboard.
You will then see this screen:
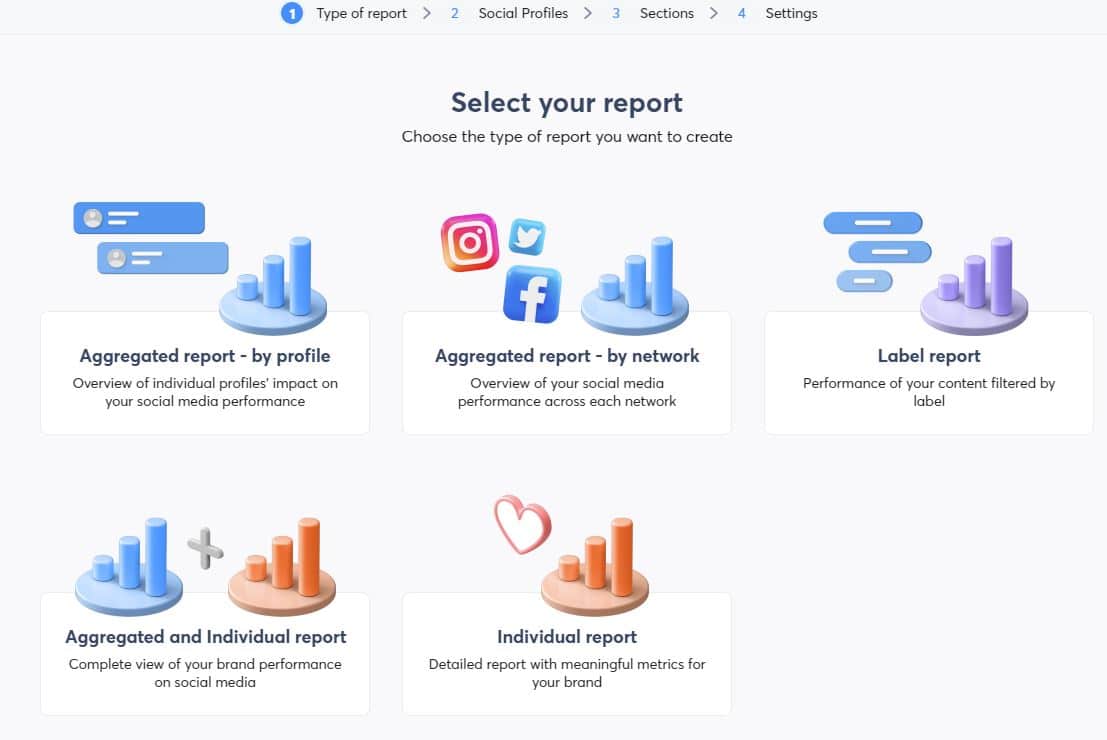
Now it’s decision time.
Choose from these types of Power Reports:
Aggregated Report by Profile
Aggregated Report by Network
Label Report
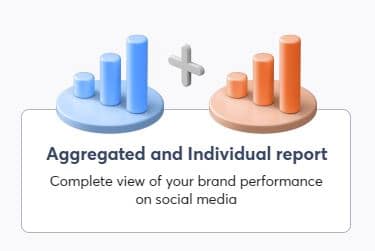
Aggregated and Individual Report
Individual Report
Explore the Features of Power Reports
We are going to look at each report type and how to use it.
Aggregated report by profile
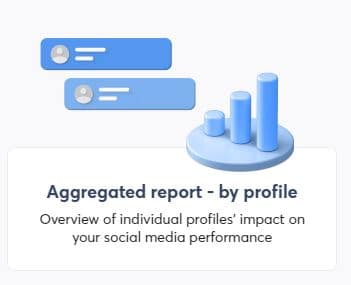
Aggregated reports combine metrics for selected social profiles and provide a top-level performance overview. This is helpful if you want an overview of all your brand’s social profiles across social networks.
Choosing aggregated reports by social profile will combine metrics across social profiles.
Example: You manage a Facebook Page, Twitter profile, and Instagram account for one brand. This option will allow you to combine selected metrics from all three networks into a single set of metrics.
First, select the profiles you want to look at. You can have up to five.
Then click Next.

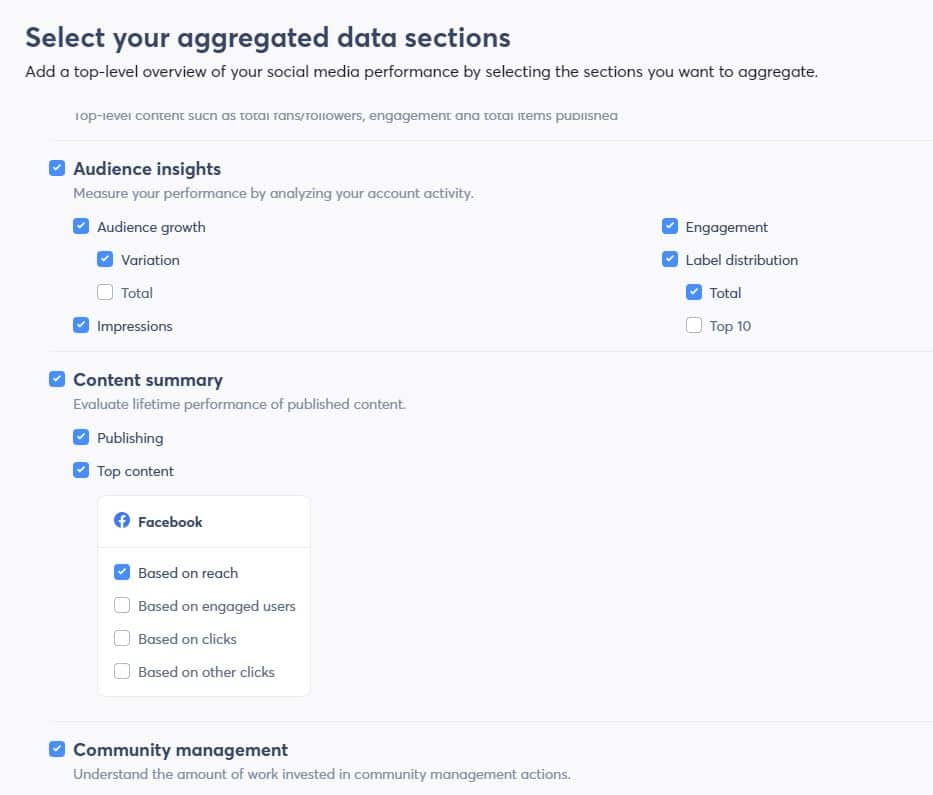
Now select the data you want to see for these networks. You can check or uncheck to suit the KPIs of your client and what you want to show them.
Keep your parameters consistent each month.
Now complete your report settings. Setting your time zone is important if you plan to schedule reports. (We will talk about that in a minute.)
💡Reporting Tip: The report customization is the same for each report type, so we won’t repeat them. Just know you can do it for each report type!
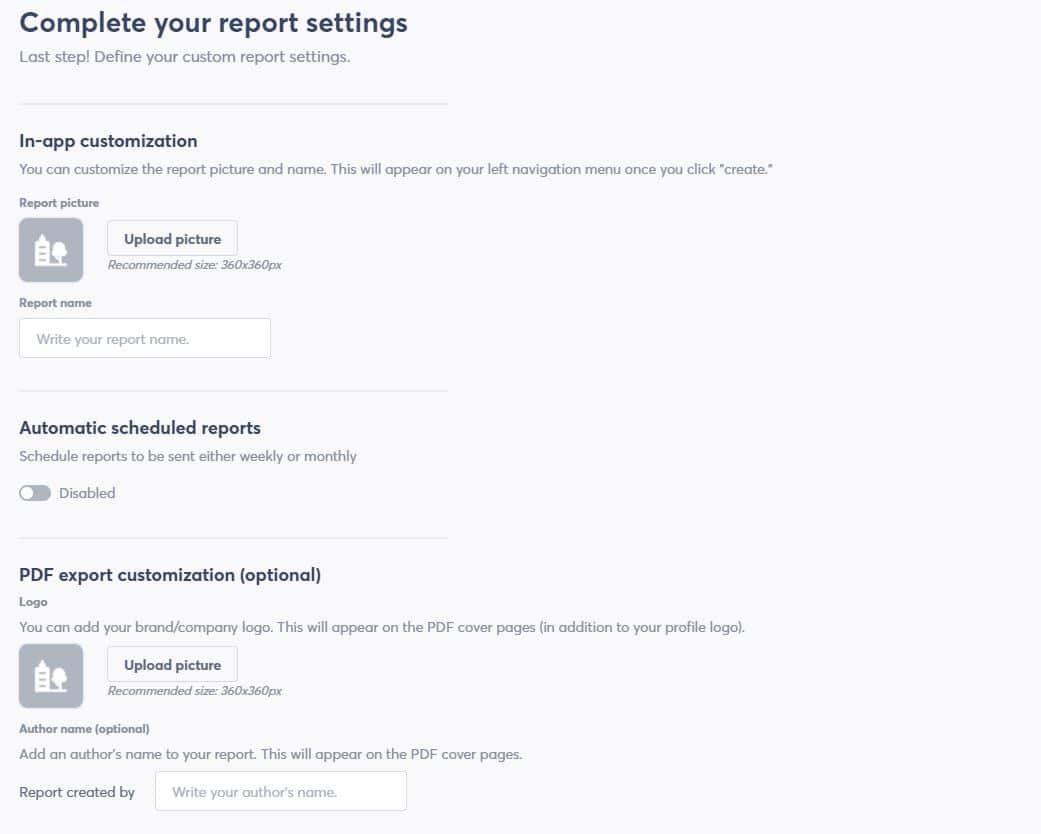
Add your client’s logo and the name of the report.
Let’s imagine Agorapulse is the client, and the report is for June 2021. These details will appear on the final report, so upload a good quality logo!
Next you can set up the report scheduling. Switch the tab to Activated and choose Weekly or Monthly.
Now select the recipients for the report.
💡Reporting Tip: You can add multiple emails here for internal recipients and external recipients. Leave your own name checked, so you can review the reporting along with the client.
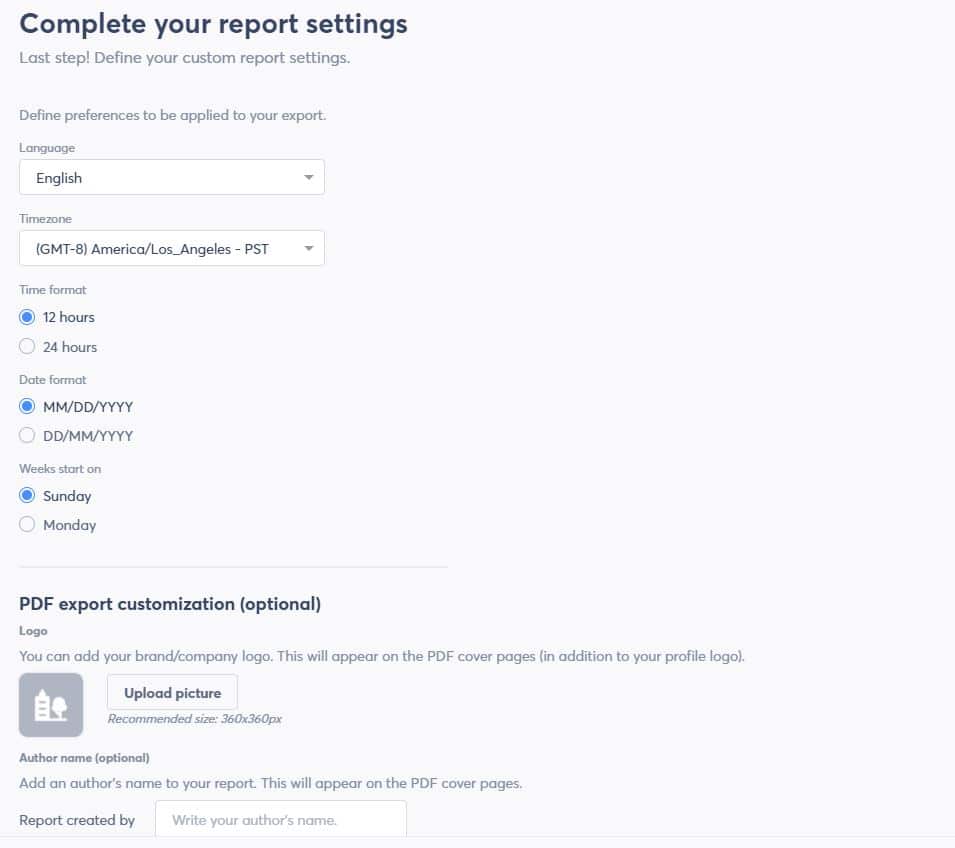
Configure the specifics of when you want your report to go out and in which language.
Languages available are:
English
French
Portuguese
Spanish
This is a huge winner if you’re managing multilingual clients. Of course, you should also be able to understand the report!
Choose the time zone you want the report to go out in and the date format. This is important because clients in Europe usually start with day/month/year.
Clients in the USA are usually month/day/ year. You can also choose the day that the week will begin on.
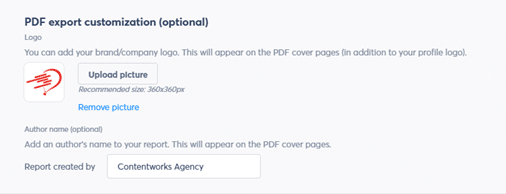
Lastly, we are going to upload our Agency or Freelancer logo and name. Again, this will appear in the report as the author, so be sure to use a high-resolution logo. Once you have done this, click Create.
And voilà! Within a minute, the report is created.
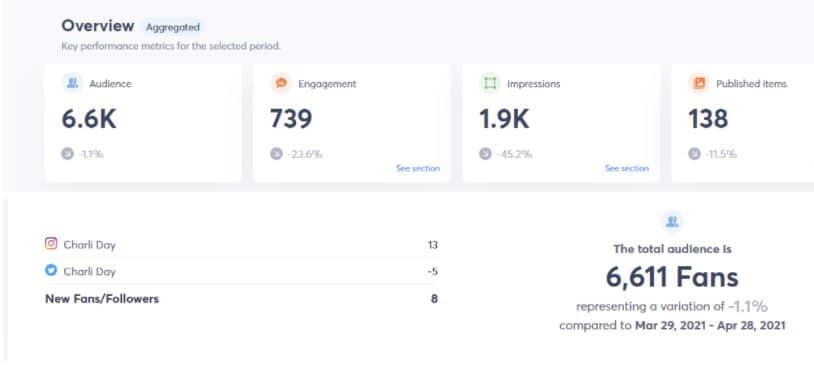
The following is an aggregation of my personal Twitter and Instagram accounts, so you can see an aggregated overview of both.
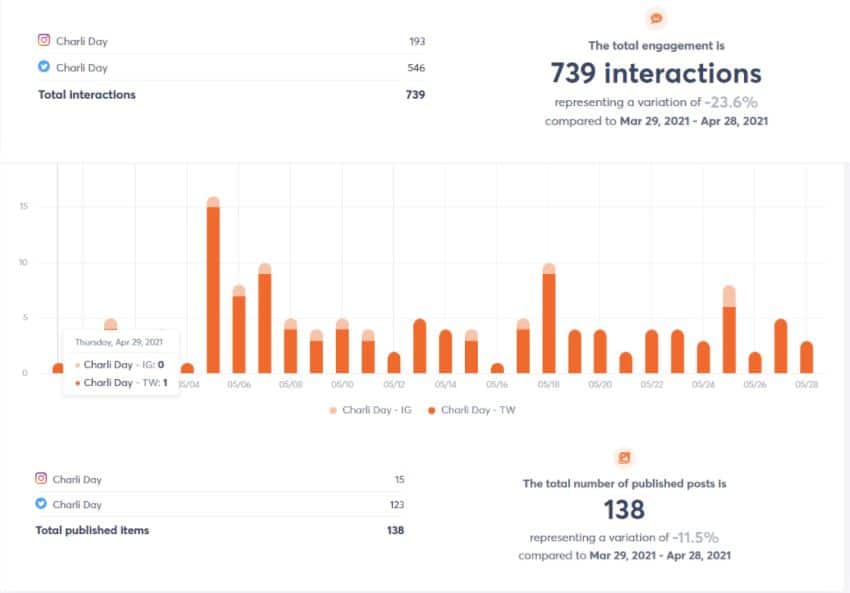
(If you have set automatic scheduling for your reports, they will be delivered automatically by email. You don’t need to log in each time to create them!)
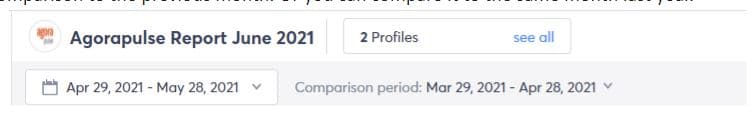
You can easily change the report date at the top of the screen without needing to go back through the customization. You can also adjust the comparison period. This is ideal for comparison to the previous month.
Or you can compare it to the same month last year.
Once you’re happy with the report, you can hit Export Report in the top right corner. The report will then be sent to your email within a few minutes.
The report is now delivered and beautifully presented according to your customizations.
Remember earlier we added logos and titles? It’s well worth it!
The Aggregated Report by Profile type is ideal for clients who want an overview of their total social media presence. They don’t want to see content specifics or follower demographics. They just want to know that their channels are growing in the right direction.
Aggregated Report by Network
Aggregated reports by social networks are great when you want to combine metrics for all selected profiles based on a social network.
Example: Your agency manages two Facebook Pages and two Twitter accounts for a client. This type of report (aggregated report by network) will allow you to combine the metrics for both Facebook Pages and then both Twitter accounts, so you’ll have a single figure for engagement for all Facebook Pages and Twitter accounts.
So, let’s do just that.
Select up to five social media profiles. (This could be five Twitter accounts for one client if you have them then hit Next.)
You will be taken again to your aggregated data sections. You can check or uncheck boxes according to the data you want to display.
If your client is interested in engagement you will want to click Based on Retweets, Based on Engagement, for example.
Next, you will complete the report customization. That’s your time zone, logos, scheduling, and report name. You can refer back to our highlighted section above to check how!
And you’re done.
This is what an aggregated report by network looks like:
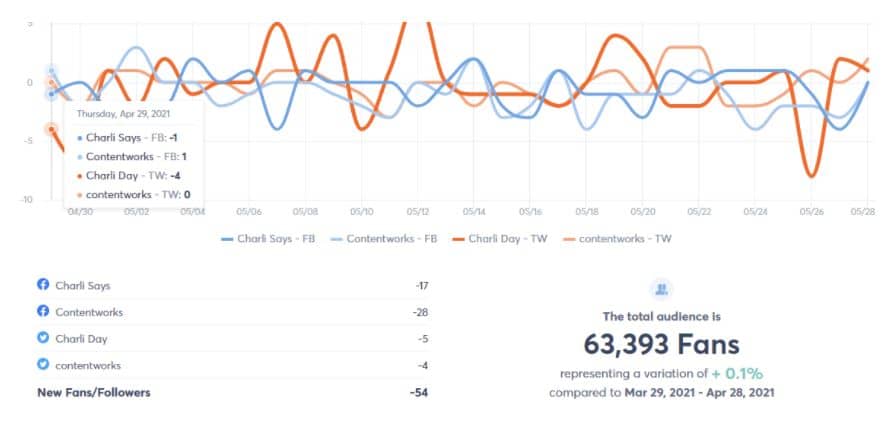
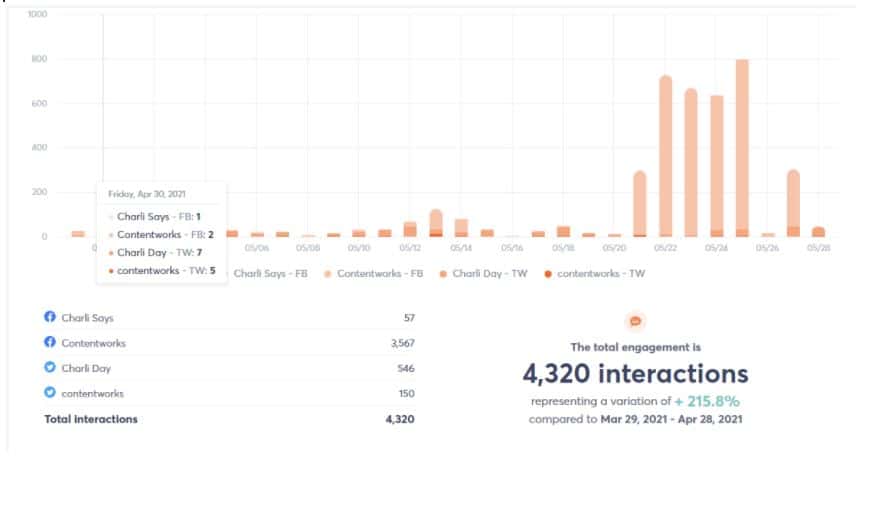
The great thing about these reports is they show the individual breakdown and the aggregated total. That makes for some very impressive high-level reporting.
For example: I can tell the client that their total engagement is 4,320 interactions in a month across four channels. Their total audience is 63,393 fans. They published 378 posts across their channels. These are impressive numbers that prove the worth of your agency!
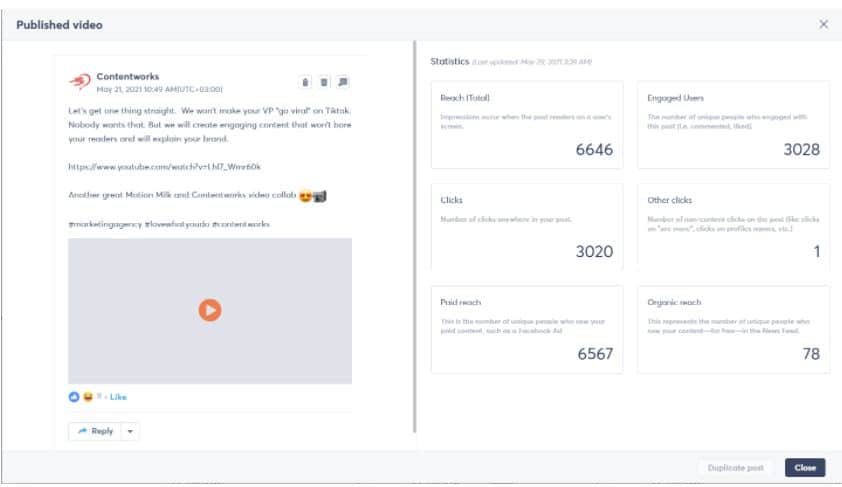
In the aggregated report by network, you can also view top-performing content. This is presented per network based on reach.
What’s awesome here is that you can click on each individual Top content box, and get more details about the post and metrics. That’s Reach, Clicks, Engaged Users, Clicks, Other Clicks, Paid Reach and Organic Reach.
The example below was a sponsored video on my agency’s Facebook page.
For the two aggregated report types, you can’t combine all the data types.
Here’s what you can combine for the two aggregated report types:
Audience insights
Overview (key metrics)
Engagement
Audience growth
Impressions
Content summary
Overview (key metrics)
top content
published posts
Community management
Overview (key metrics)
Replies sent
Reviewed items
This type of report is ideal for clients with multiple accounts on the same social network. For example, two Twitter accounts. It also provides agencies with the ability to present both aggregated and individual stats. This is something that is easily understandable immediately and impressive to stakeholders in the company.
What to include in your social media report
Label Report
A label report allows you to track the success of marketing campaigns and attribute it to tags relating to:
Discounts
Products
Influencers
Collaboration
Posted by
Location
Other tags
Create as many labels as you need for up to five social profiles.
Select the Label Reports option.
Select the profiles where you have added your labels.
You can select all the sections or just an overview of the performance of your top content.
Customize the report. (Ask yourself: How can you name this report? Who should receive this report? Do you need to include your client’s logo? Does your client or team need to receive this regularly?)
You can schedule your report.
🎬Watch this short, helpful video to see exactly how to create label reports.
💡Reporting tip: You have to be using tags to benefit from this Label Report. So, it’s better if you decide in advance of a campaign or posting strategy.
This type of report is ideal for presenting data following a campaign.
As an agency, this is especially important if the campaign had a budget assigned to it or involves an influencer or outside collaboration. The reports are clear and identify areas of success for all the tags you’re monitoring.
Aggregated and Individual Report
Now we’re getting into some seriously meaty reporting types.
The aggregated and individual report is a mega-report with up to 12 channels included. (That’s right. Twelve.)
It will display aggregated and individual reports, making it ideal for clients wanting a bit more detail on their channel’s performance as well as an overview.
First, you’re going to select your channels, when you’re happy with your selection, hit Next.
Define your custom report settings. (That’s your time zone, logos, scheduling and report name.) You can refer back to our highlighted section above to check how. Then click Create.
The top level is your aggregated results. That’s your total audience, total engagement, total impressions and total published items for all your selected channels. If you chose 12, then this is the total right here.
You will see your total aggregated engagement and then on the left broken down by channel. Note this is by channel, not by profile.
You can see the same for impressions with aggregated totals on the right and social media channel breakdowns on the left. Impressions are interesting for brand launches or campaigns that need to demonstrate brand awareness. That’s because they represent the number of views on your social profiles.
💡Reporting Tip: Utilize the comparison tool to illustrate the effectiveness of your social media efforts. Here you can show the difference in impressions from one month to the next, or, one month in 2021 compared to one month in 2020.
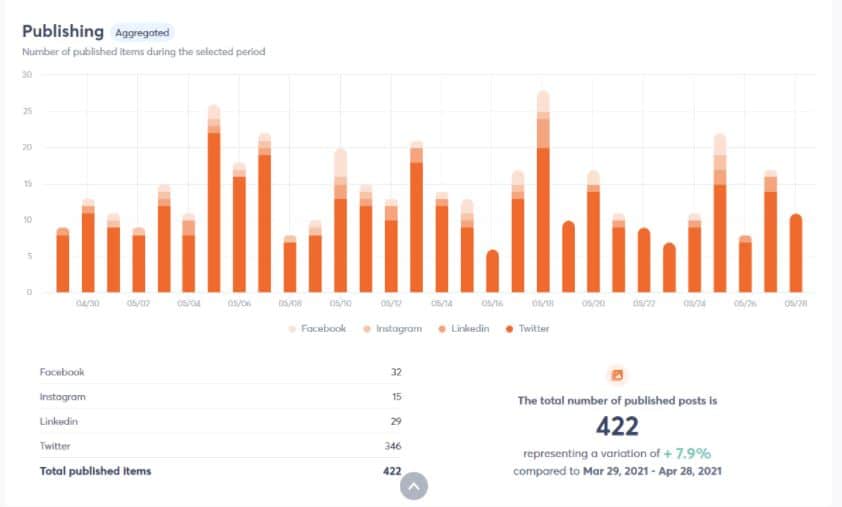
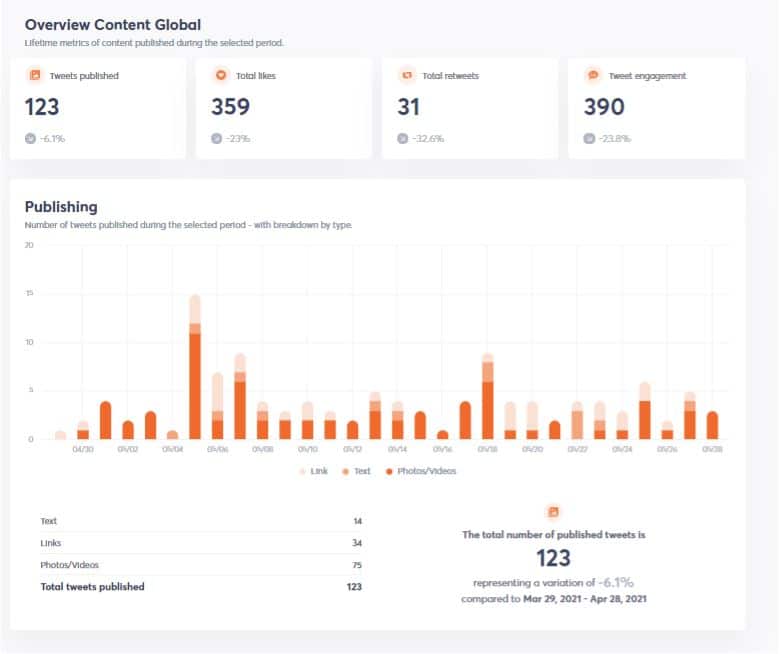
You can view the total published posts both aggregated and separated. If you’re a social media or content marketing agency providing posts, then this is an impressive stat to highlight.
Example: As below you can see that across four channels, we published 422 posts in a month. Most clients would not want to produce that level of content for themselves!
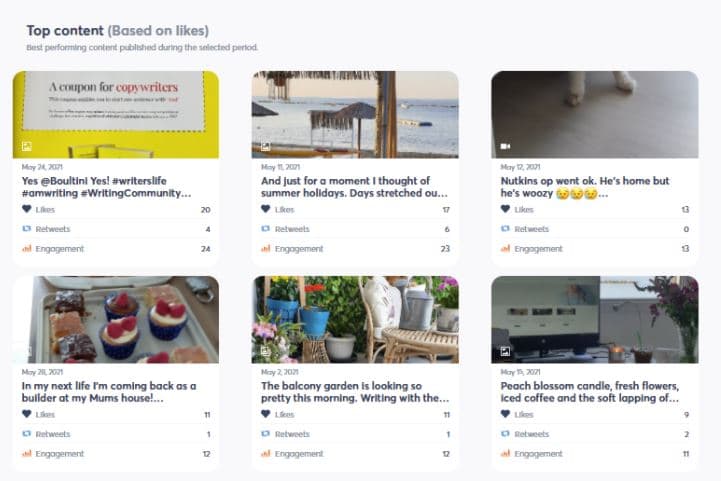
You then will see the top content for the channels you have selected. Clients love this part because it’s a very visual and clear snapshot of what works. By clicking on each box, you can see the full post and detailed metrics. That data helps to guide future content recommendations and resourcing decisions. Facebook and Instagram top content are based on Reach; LinkedIn is based on Impressions and Twitter on Likes.
💡 Reporting Tip: Take a moment to dig into your client reports to see what didn’t work well. Understanding what works and what doesn’t is important for guiding future content decisions and allocating budget for boosts or campaigns.
Get content ideas from your social media report
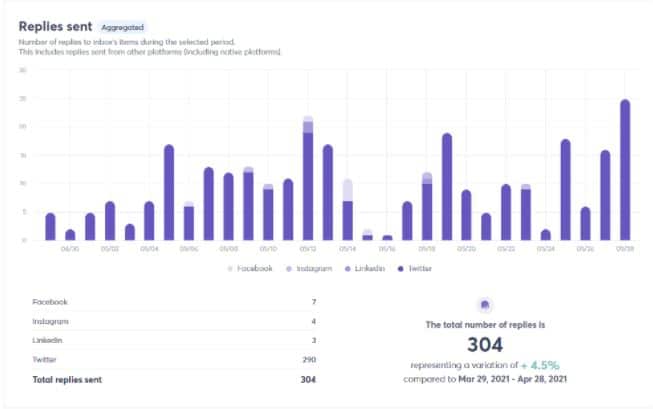
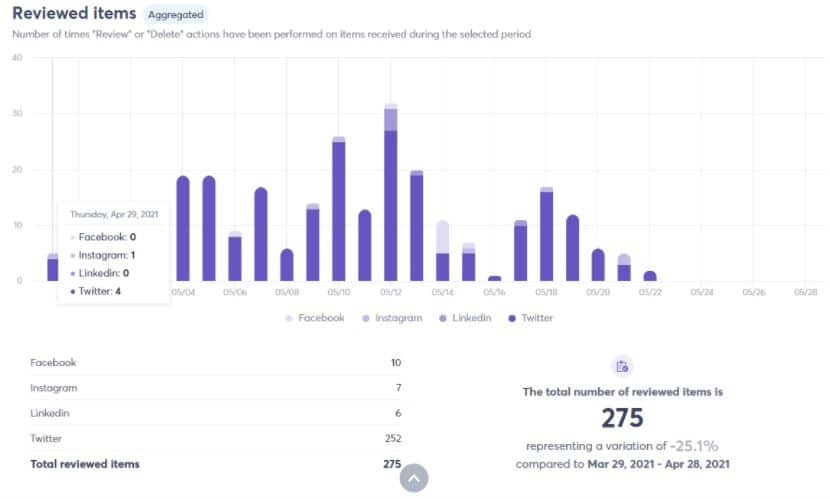
Replies Sent and Reviewed Items are nice metrics to share as they indicate that you as an agency are on the ball in managing client comments and replies. It also shows where your focus and energy are most needed for your channels.
For example, we see below that Twitter needed 290 replies and had 252 reviewed items; LinkedIn only had three and six, respectively.
The report also highlights your channel engagement levels.
This is a winning report and probably the most used at our agency. That’s because it allows multiple channels to be added. (Did I mention 12?)
It also shows individual and aggregated results, top content and community management stats.
But it’s not too long for busy clients to read.
Start creating reports for multiple agency clients
Individual Report
Last but definitely not least is the Individual Report.
This magnificent beast also allows you to add up to 12 profiles—only it isn’t going to be aggregated.
It will combine all the data in one PDF report, but it will list each channel’s performance separately.
We use this report type for clients with multiple accounts managed by different teams in the same company.
Example: A large finance company has 10 social media channels. But two are in French, two are Arabic, and the rest are in English. They are managed by different teams in different regions with different KPIs and targets. This client will not want his channels to be aggregated. He wants to see individual performance.
Select up to 12 social media profiles for your client or account then hit Next.
Now, because this is a very detailed report, the next page is going to allow you to customize what you see in the report for each channel. You can adjust all the parameters separately for each one.
Example: For Contentworks’ Twitter account, I can select numerous parameters specifically relating to Twitter like hashtags and interactions, brand awareness score, label distribution, and listening.
When I switch to the Contentworks Facebook reporting options, I will receive Facebook-specific metric options like demographics for the channel and impressions.
💡 Reporting Tip: There are so many incredible options available with this Individual Report. But it’s important to show consistent reporting to your clients.
Keep your checked parameters the same month on month to avoid confusion. (Agorapulse automatically checks popular metrics for you, so you don’t need to change it at all!)
Once you have chosen your reporting parameters for each channel, you can click Next and go on to customizing the report. (Refer to our first step to remind yourself how to do this.)
When your report is produced, you will see that it details the performance of each channel separately.( Don’t worry though … These will be delivered in one PDF!)
💡 Reporting Tip: You can quickly flick between profiles at the top left side of the report. When you do this, the report jumps to the section (channel) you want to view.
Remember nothing is aggregated here, so the total followers, engagement, brand awareness are per channel.
An addition to this report is the User’s Activity. This can’t be aggregated as it is specific to each channel and therefore not included in aggregated reports.
We love this chart as it shows when users are most active for each channel. This helps guide decisions about what time/day to post content.
Remember that using the Agorapulse calendar, you can schedule content in other time zones, too. It’s really that easy.
Another great feature on this report is the Brand Awareness Score. This feature monitors mentions of your brand name and listening searches.
Remember though, this is per channel so doesn’t represent your client’s overall brand awareness.
Facebook Brand Awareness Score
Instagram Brand Awareness Score
Twitter Brand Awareness Score
It does, however, show which networks are performing best for this metric.
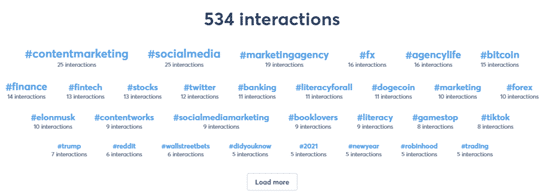
This report shows top hashtags that performed for your channel! It’s a super-informative feature which guides your content decisions (or probably should anyway).
Each section of this report finishes with a summary of content on that channel including amount of content published, total likes, retweets, shares, engagement.
Of course, that is all important top content. This reporting option displays more detailed metrics and more top content posts.
This report also tells you the best day and time to publish.
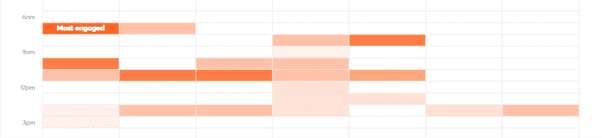
For example, my Twitter account is getting viewed most at 7 AM on Tuesdays. However, after 9 PM, it gets very little traction. This is significant if you’re an agency running campaigns for clients. You need to know when their target audience is biting!
This report also tells you the type of posts and tags that perform best. Remember, label data will only be available for channels you have used them on.
This overview of community management and team performance will be interesting to busy companies with internal community management resources. It also shows average response time, which allows for improvement and goal setting.
You can also see the performance of individual team members allowing for mentoring and coaching.
Remember, social media users expect to be answered within several hours.
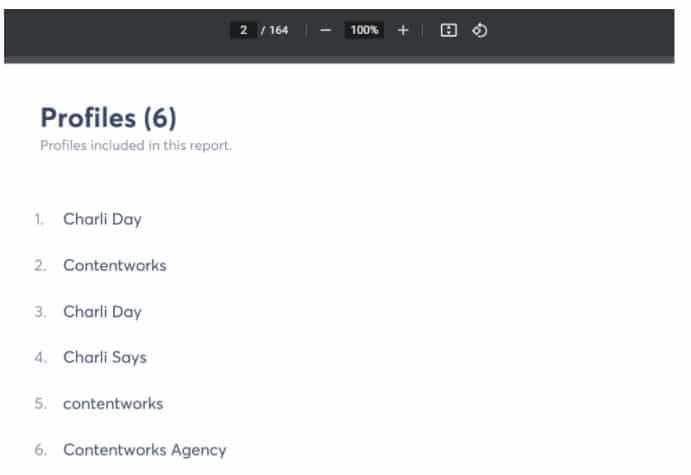
When you export an Individual Report it will collate ALL the data into one beautiful PDF. To give you an idea of the detail involved, the six social media profiles indexed below equal 164 pages of PDF reporting!
What I love is that each channel is separated by a mini header and channel image or logo. This makes the report detailed, but still very easy to navigate.
What I also love is that the reports feature bright and bold graphics. They don’t cram too much on one page.
For example, the demographics sections are laid out clearly and are instantly understandable. (Top level execs love to see these.)
This reporting type is really detailed and impressive. Clients with multiple offices, different teams and a keen eye for social media reporting will love them.
Similarly, clients carefully monitoring each channel and the impact of budget spend will be delighted.
However, if your client is Miss “I Don’t Have Time To Read This,” then don’t use it. Reports need to be right for your client, and a client who doesn’t have much time won’t be thrilled with hundreds of pages to read!
Prepare now for end-of-year social media reports
Can Power Reports Really Help Social Media Agencies?
Yes, they can really help social media agencies!
Agorapulse is an agency favorite because they understand our pain points and address them head on. They also know the time constraints, client demands, and resourcing struggles faced by social media agencies
The Agorapulse dashboard combines everything an agency needs to successfully manage multiple clients in one place. That’s scheduling, responses, assigning team members, and creating killer reports.
Collating social media stats from multiple channels, pulling out their KPIs, and turning them into a good-looking report can take hours. That’s hours a social media marketing agency doesn’t have. It’s time-consuming, tedious, and really messy!
Now with Power Reports, we can pull off impressive reports in just a few minutes.
Why Do Agencies Love Power Reports?
Clients love them
This one is first because a happy client is a happy marketing agency. If a client finds the reports well-presented, easy to read, and fun to share, the client will be happy.
Clients will also appreciate your efforts more when they can see what you did.
Power Reports also save time explaining data and double-checking stats and figures with confused clients.
They are time-saving
Imagine creating a report in minutes or scheduling it to send automatically! That’s time you could be talking to clients, planning campaigns and making TikToks with your office pet. (I’ve heard. Cough, cough.)
They’re so easy
You don’t need to log in and out different social media networks. On average, each of our clients has three social media networks managed by us. Multiply this by 15+ clients and you have 45 logins. (Arggggghhh, no thanks.)
They are accurate
What I realized in creating reports manually is that there may be inaccuracies in the data. That could be because you’re not comparing time frames correctly or your manual calculations and comparisons about follower numbers and engagement are incorrect. Busy, stressed-out social media managers can easily make these mistakes.
Power Reports eliminate human error. It works out the accurate data, comparisons, and even competitor snapshots using Agorapulse Barometer, so you don’t have to.
Get Started With Power Reports
Power Reports save time, effort, and stress for agencies and busy social media managers. The biggest win is that clients, bosses, shareholders and investors love Power Reports, too.
We know you’re going to love Power Reports!
Start preparing amazing social media reports right now.
Check out our free trial of Agorapulse to help you schedule, track, and measure all your social media efforts.
Read more: agorapulse.com


