
Oh, how the time flies. We’re already into March of this young 2017, and as much as it pains me to say, it’s probably about time we begin thinking about Holiday 2017. But such is life, and if we have to do it, we might as well do it right.
So how do we start to think about “doing it right” in Holiday 2017? Well, as an analytics guy, I might be biased, but I believe the data contains the answers. While there are obviously many more factors, which you can see in our 2016 Holiday Insights webinar, data points and concepts to consider, let’s dive into a few interesting 2016 holiday marketing insights that can help you begin prepping for this upcoming holiday.
First, a quick note on the data in this post – all data is collected from a holistic study that examines a single inbox designed to mimic the “average” consumer…and since, on average, most email subscribers aren’t doing more than opening, we make sure that no content is clicked through and no transactions are recorded. We then coded each email on a variety of different metrics, some of which you’ll see below. Finally, in order to increase the robustness of our evaluations, we examine each brand within the study individually, first by calculating the overall average KPIs for the time period within the study. Then, we compare each mailing for each brand against that brand’s baseline, creating a +/- metric on a per campaign basis. Then, we average those metrics across each brand, creating a model for expected performance compared to the “typical” mailing.
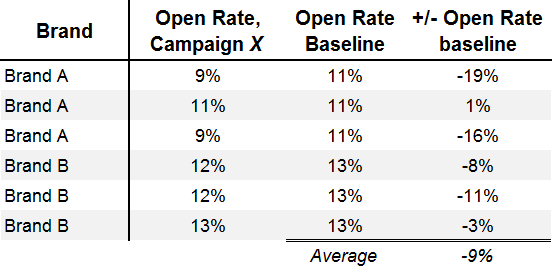
To illustrate, let’s examine the following (simplified) sample table. Suppose we want to know what the “expected” impact of X for a brand’s marketing program. In the table below, we’ve gathered the open rates for campaigns that exhibit X for brands A & B.
The table also shows the long-term average open rates for each brand, and the percent change of the campaigns compared to that baseline. By averaging those results, we get a holistic “expectation model” for campaigns exhibiting X. In this sample, we can generalize to say, any campaign including X for any brand should, on average, expect an open rate that’s about 9% lower than their long-term baseline.
Peak week’s heavy influence
I don’t think it’s an earth shattering revelation that the data shows peak week’s performance as being significantly above average, but it often surprises me to see just how much better it does than the surrounding time periods. This is easily seen in the chart below, where I’ve plotted every single mailing’s +/- revenue per email over time. I’ve categorized the mailings as “holiday” vs “standard” to see if there were any significant patterns. As you can see, most mailings performed worse than the baseline, due to the baseline being so heavily influenced by peak week, with mailings performing 2-5x better than average.
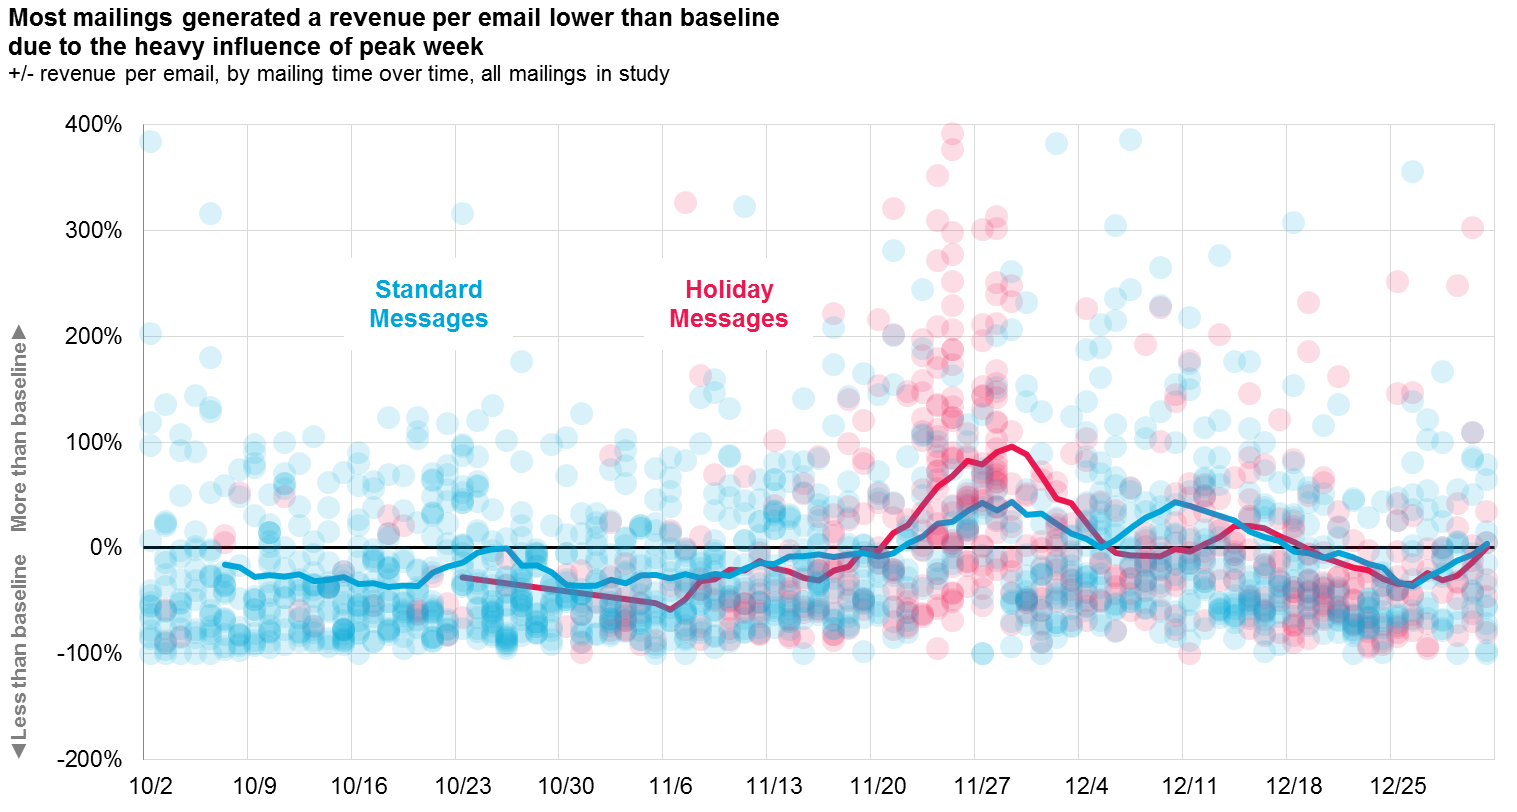
What does it mean? Peak week’s impact is large enough that brands might want to consider viewing it in a vacuum, away from the days surrounding it, in order to get a better read on the overall health of their email program. Your brand should expect much better than average results throughout peak week, of course, and if the data doesn’t show that, you might be in trouble!
Holiday messages get a boost with subject line mentions
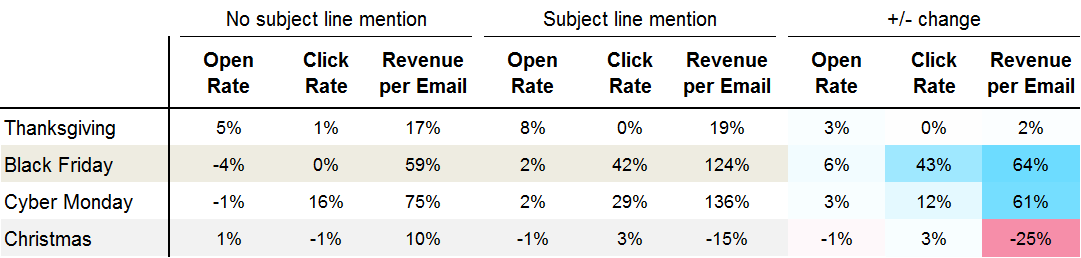
Throughout holiday, creative treatments and copy call out or hint towards specific holidays. Overall, those holiday messages generally perform better than average across all KPIs, as shown below. These results improve even further when those specific holidays are mentioned within the subject line, with Black Friday mailings seeing the largest increase when combined with a subject line mention. What’s most interesting to me, however, is how negatively Christmas themed mailings were affected when the holiday was called out in the subject line (a net 25% decline in revenue per email).
All of these results may arise from a case of self-selection bias, whereas we should expect a specific holiday message to do better than average simply because it’s a specific holiday theme. This concept works in a few ways:
a) If a company is giving a great offer, they might want to make it feel more “special” by creating a unique theme and selling concept around it (the holiday) .
b) If a company has decided to devote resources to creating a mailing designed around a specific holiday, likely requiring a change in the creative process / design or additional strategizing around copy and positioning, then they will likely want to attach stronger offers to make the increased effort worth it.
c) Due to the date of deployment, companies are more likely to both add strong offers and devote creative resources to a mailing because they implicitly understand that customers are more likely to engage on those days due to larger economic or societal trends and to differentiate themselves from the noise.
d) If companies are devoting good offers or creative treatments to a specific holiday (or both), then the best companies realize that they should signal this with a mention in the subject line, leading any message with a holiday mention to of course do better
What does it mean? The data highlights a particularly interesting in holiday email analytics – understanding causal effects. Sure, theming a mailing around a specific holiday might be the cause for the improved metrics, but it’s more likely that we assign holiday themes to a mailing that would have done well already. This is a much larger concept to think about in marketing, and the main takeaway is to be highly critical of any causal inference you make regarding performance.
There are bigger factors at play with subject lines than length
I have a deep-seated skepticism of any broad subject line analysis – subject lines are a quagmire of entanglements, where no single feature can ever be considered in a vacuum against any other feature. And yet, a tiny bit of Googling reveals hundreds of posts about subject lines, ranging from improving open rates with personalization and emojis to the grand-daddy of them all – shorter subject lines improve open rates.
The argument for shorter subject lines in and of itself is an entanglement nightmare, since shortening a subject line can mean creating more clarity and precision to what you’re saying or cutting off back end details that might not be important or making sure relevant data always shows up on mobile. All of these are good ideas, but they are lumped into “shortening subject lines,” despite being fixes for potentially different problems. Oh, and never mind the fact that I’ve never seen any real analysis backing up the broad idea that shorter subject lines create higher “expected” open rates (most don’t normalize the data to try to control for subject line length, and therefore likely read other confounding factors).
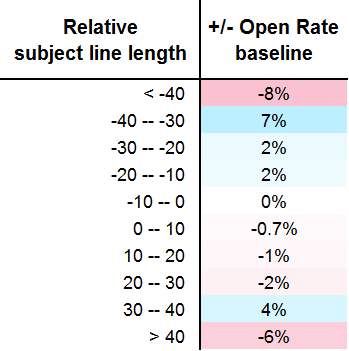
Our holiday study demonstrates the lack of empirical evidence behind the maxim of “shorter equals better,” showing a wide spread of outcomes at each subject line length and little discernible correlation.
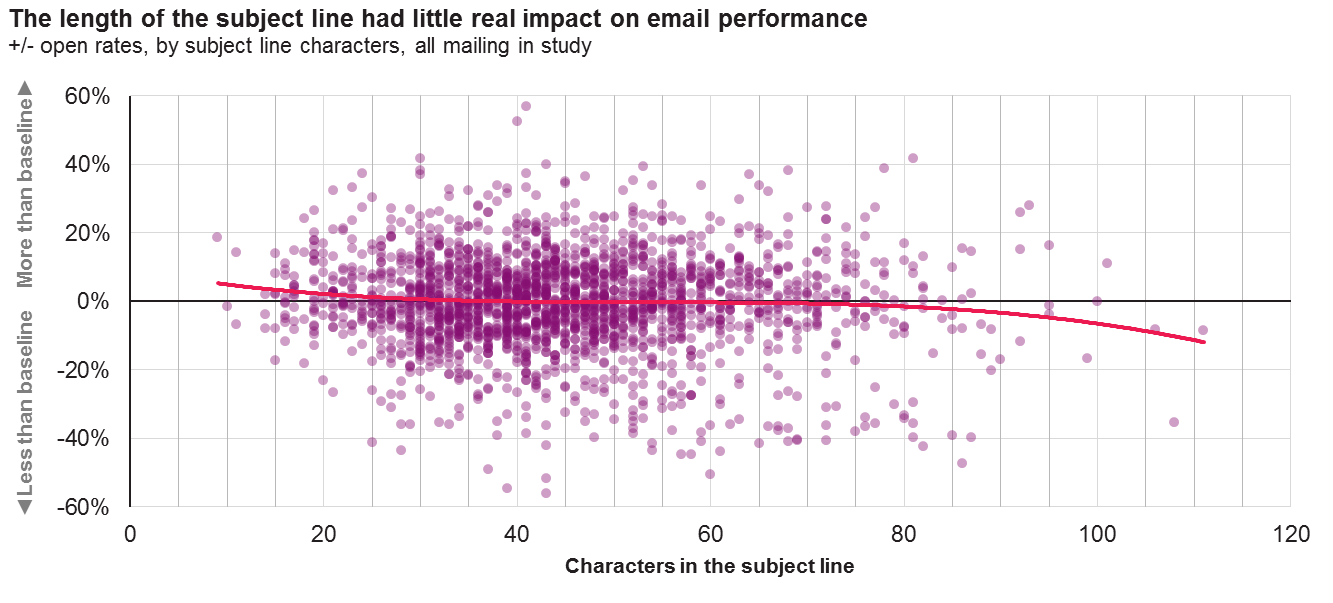
Even controlling for longer or shorter subject lines versus the brand’s average shows no real pattern, suggesting that brands that radically increase or reduce their subject lines aren’t expected to see much of a change in open rate performance.
What does it mean? Engagement in your mailings is predicated on a much broader combination of relationship building, consistency, and brand value than the subject line – especially its length. Sure, shorter subject lines might force brand’s to be more precise and clear in detailing the mailings contents, but just lopping off words isn’t the most sophisticated path to brand positioning out there, is it?
As with any sort of data-driven recap, it can sometimes be difficult to understand what our major takeaways are – after all, shouldn’t we just do what the data says? Not necessarily. The great thing about any “global” recap is that it allows for greater context around your own strategies, ideas, and performance. While the data may suggest particular things (add a specific subject line call out for holiday mailings!), more nuanced thinking might suggest deeper reasons (confounding factors!). That doesn’t mean a recap isn’t important or useful: it just means you – as a brand or strategist or tactician – have to be well informed of what the data says and what it implies. Then you can adapt your strategies accordingly. Of course, if you need some assistance, you can also reach out for help with campaign analysis or marketing strategy. And, as always, happy planning!
Interested in more strategic and tactical planning tips? Watch our webinar “Trends are dead ends: Create a clear road to success with our 2017 planning tips” for free!
The post Finding your baseline for better Holiday email analytics appeared first on Marketing Forward Blog.
Read more: experian.com


