It’s no secret that here at Agorapulse, we have a lot of Agency Love. We love supporting digital and social media agencies with our scalable program, our all-in-one social media solution, and our insightful research.
That’s why we’re so excited to share our 2021 State of Social Media Agencies report with you. To create this report, we reached out to over 100 agencies and asked dozens of questions about everything from size and scope to paid vs. organic campaigns to pain points and future plans. Among other things, we learned:
Out of all social channels, Facebook is the most popular platform for agencies to manage – but that’s not the channel that drives the best organic results.
Live streaming and Messenger marketing aren’t as popular with agencies as general statistics suggest – which may mean they have untapped potential.
Across the board, agencies are struggling with reporting and demonstrating return on investment (ROI) – but we’ve got some solutions for you to try.
Ready to dive into the results?
hbspt.forms.create({
region: “na1”,
portalId: “8477337”,
formId: “32f0dc74-0d5e-4438-9acc-0b0f1dbbc6e3”
});
Agency Basics: Size, Scope, and Pricing
When it comes to size, scope, and pricing, is your agency solidly average? Or does your agency stand out from the crowd? See how your agency compares to the competition.
How would you categorize your agency?
Agencies come in all shapes and sizes, ranging from boutique setups to full-service operations. When we asked our 113 survey participants to categorize their agencies, they reported a pretty even spread:
Full-service agency: 25%
Digital agency: 25%
Boutique agency: 25%
Social media agency: 20%
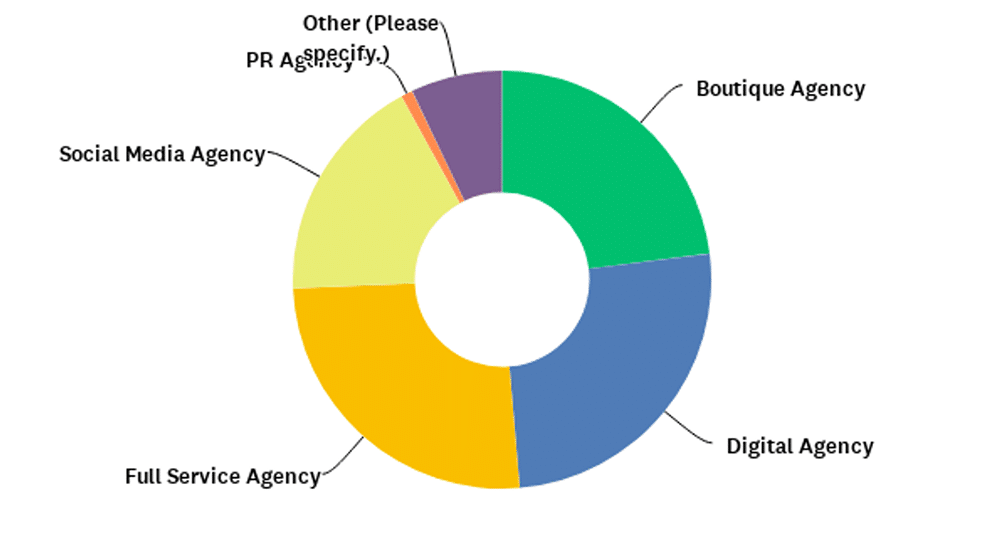
Of course, a few respondents didn’t quite fit into any of the boxes. A handful are PR agencies, content marketing agencies, or specialized consulting firms.
How many clients does your agency have?
Many agencies happily share the big-name brands they’ve worked with. But if you want to know how many clients an agency is managing, you could be waiting a while.
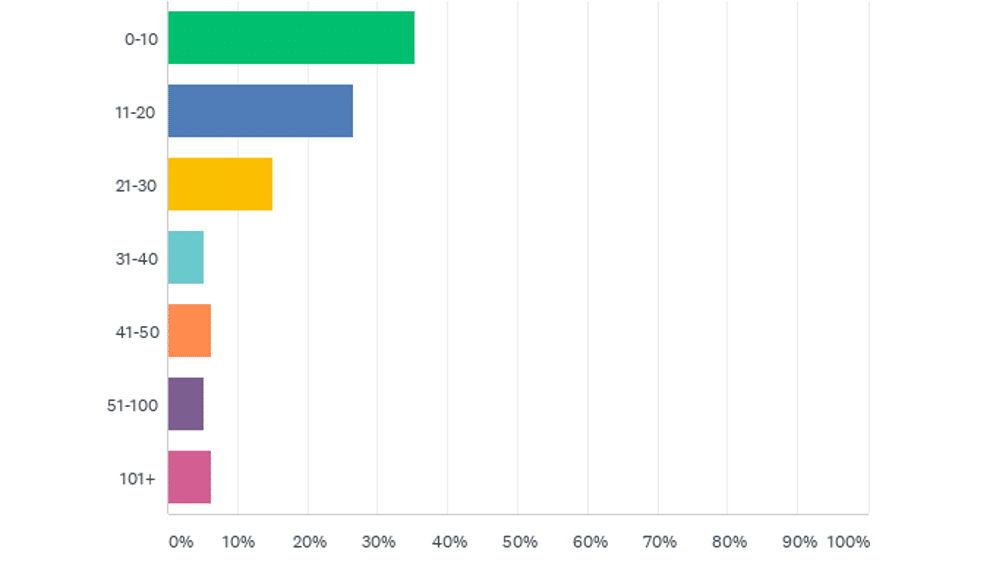
Overall, our survey participants represent relatively small agencies. About 75% reported that they have 30 clients or fewer. The largest group (35%) has 10 clients or less, while the second largest group (25%) has between 11 and 20 clients.
Were you expecting bigger numbers? Our survey also includes agencies with over 50 clients, but altogether they make up around 10% of total respondents.
How large is your agency team?
Because our survey participants represent agencies with relatively small client rosters, you might expect them to have small teams, too. If so, you’d be right.
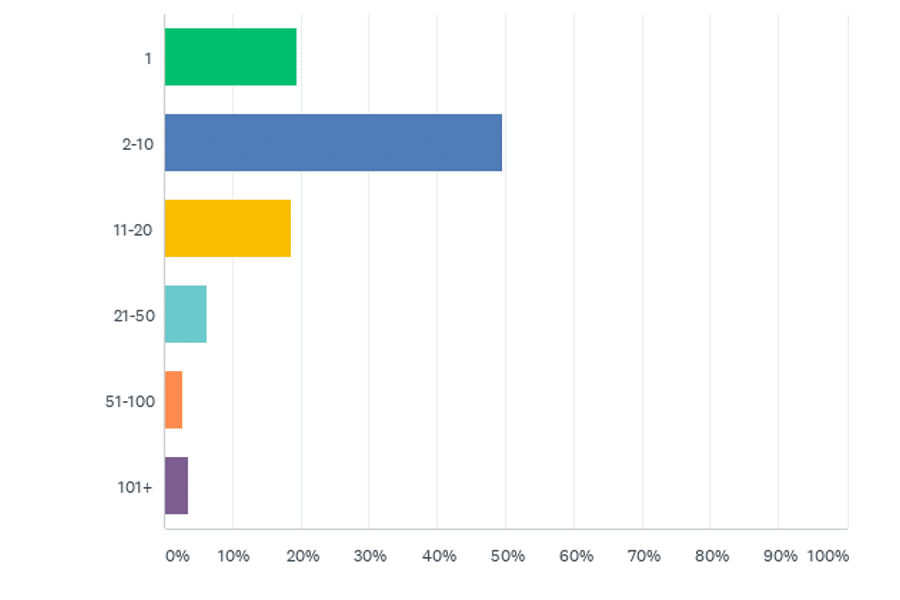
About 50% have teams of 10 people or less, and a solid 20% are one-person operations. Few respondents (about 5%) have teams of 50 people or more, which is in line with the size of the agencies that participated.
What services does your agency offer?
Although the vast majority of survey participants (almost 90%) provide social media management services, this isn’t the most popular service. Instead, a full 90% offer content creation – which can complement social media management or be a standalone service.
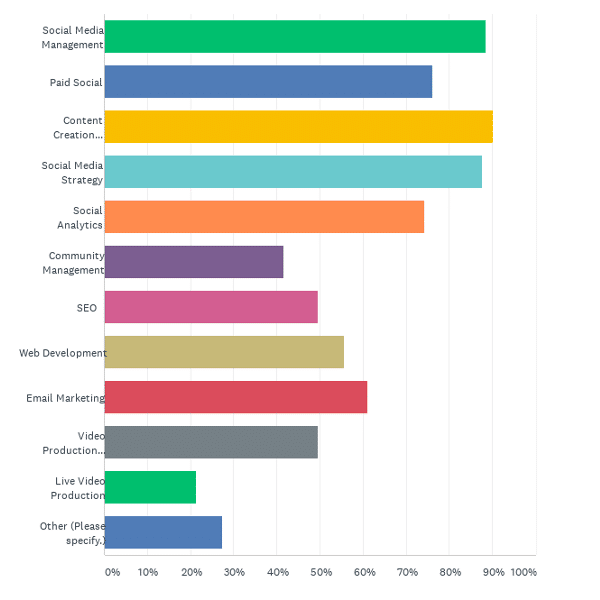
Many participants also offer social media management-adjacent services. For example, over 80% provide social media strategy, while about 75% offer paid social and social analytics. Smaller percentages provide other digital marketing services:
Email marketing: 60%
Web development: 55%
Search engine optimization (SEO): 50%
Video production: 50%
What do you charge each client per month?
Even if your agency isn’t necessarily looking to adjust its pricing, you should know what other agencies charge. Yet it’s relatively rare for agencies to share how they make money.
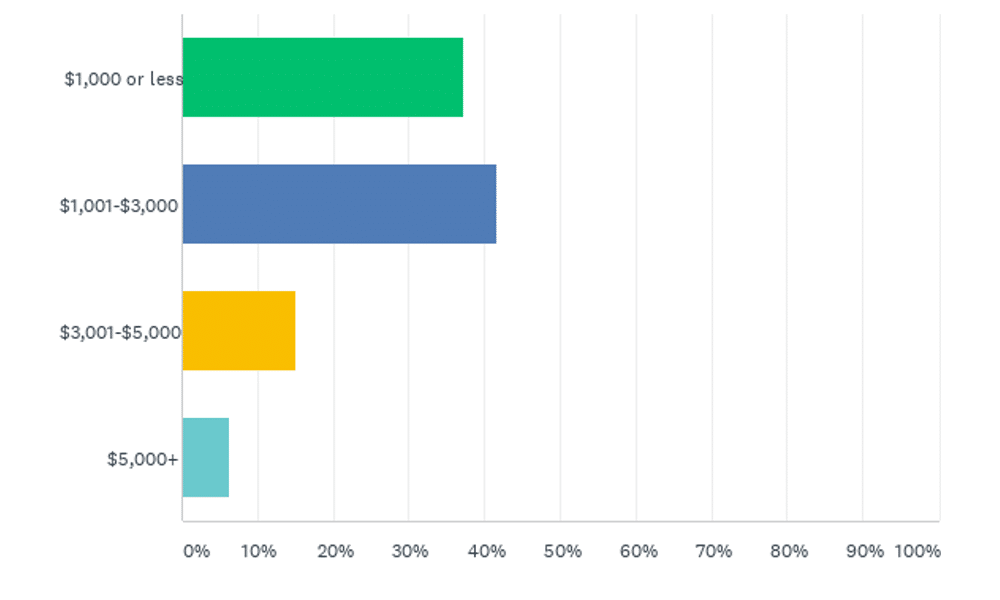
More than 40% of our survey participants charge clients between $1,000 and $3,000 per month. About 35% charge $1,000 or less, and just 15% charge between $3,000 and $5,000. Where does your agency fit on this scale?
How does your agency find new clients?
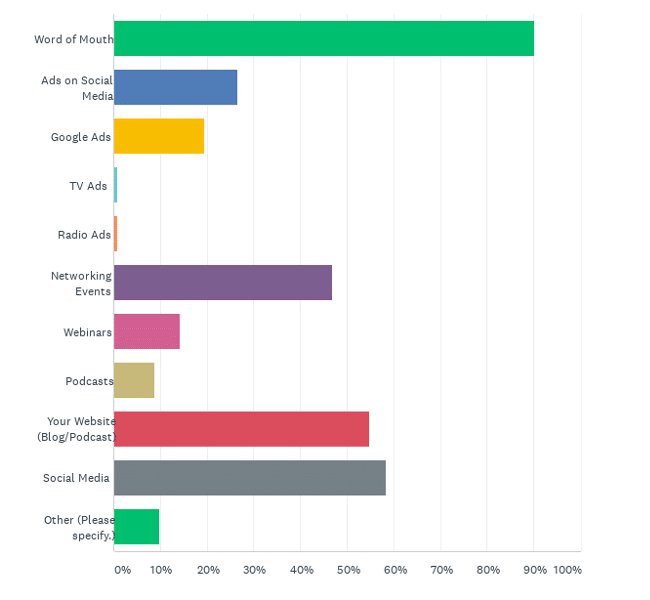
Whether you just launched an agency or you’ve been in business for years, keeping your client roster full is critical for success. Although survey respondents named over a dozen different client acquisition methods, some were more popular than others:
With a 90% response rate, word of mouth – such as client referrals and testimonials – is the most common way agencies find prospects. This is no surprise, given that over 90% of people trust reviews when making a purchase.
Social media (55%) and the agency’s own website (also 55%) are the second most common methods. These make sense because they let agencies show what they can do with social media management, content creation, and web design.
About 45% of respondents indicated that networking events are a good source of new leads. These can include industry conferences, online events, and networking meetups.
Top Social Media Channels for Agencies
Does your agency support the biggest social channels? Or does your team venture into uncharted territory and focus on emerging platforms? Get to know the most popular social channels for agencies to manage and see which generate the best results.
What social media channels do you manage for clients?
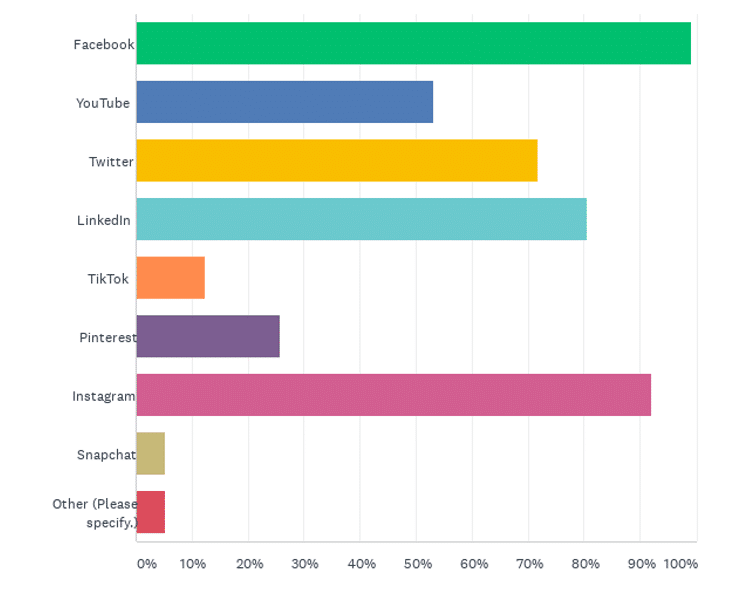
Almost 100% of respondents offer Facebook management, and over 90% provide Instagram management. As the second and third most popular social media channels in the United States, Facebook and Instagram’s high ranks on this list come as no surprise.
Interestingly, about 80% offer LinkedIn management and over 70% manage Twitter pages, even though the adoption rates for these channels are 28% and 23%, respectively.
In addition, over 80% of American adults use YouTube – and the platform continues to gain new users. However, only about 55% of our survey participants manage YouTube for clients. If you’re looking for a new channel to add to your suite of services, YouTube might be a smart choice.
Which social media channels drive the best organic results?
Although Facebook is the most popular social media channel for our agency participants to manage, it doesn’t necessarily drive the best organic results for all agencies. Instead, Facebook and LinkedIn are tied for second place, with about 45% of survey participants reporting that these channels generate the best organic results for their clients.
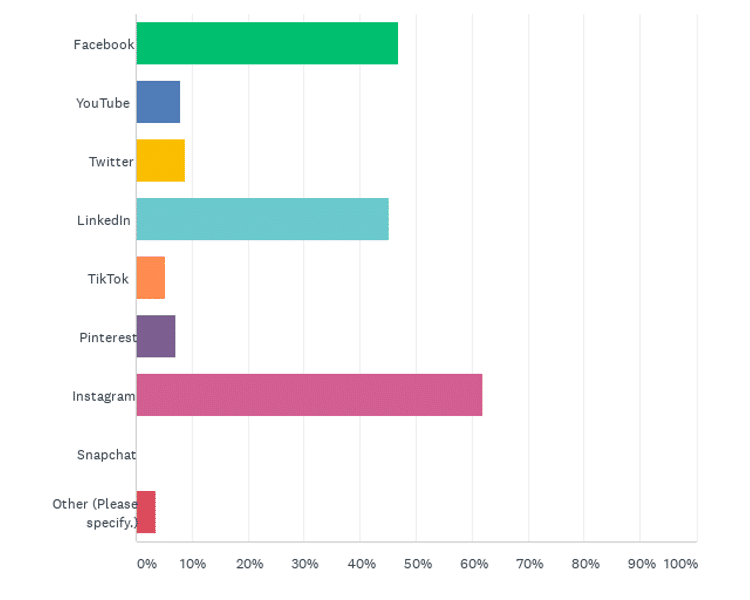
In fact, the top-performing channel for organic social results is Instagram, according to over 60% of survey participants. Other social channels, including YouTube, Twitter, and Pinterest, received less than 10% of the vote.
Which social media channels drive the worst organic results?
When we turned the question around and asked which platforms generate the worst organic results, our respondents pulled no punches. Overall, Twitter (over 40%) stands out as the worst channel for organic results, while Facebook (over 35%) is a close second.
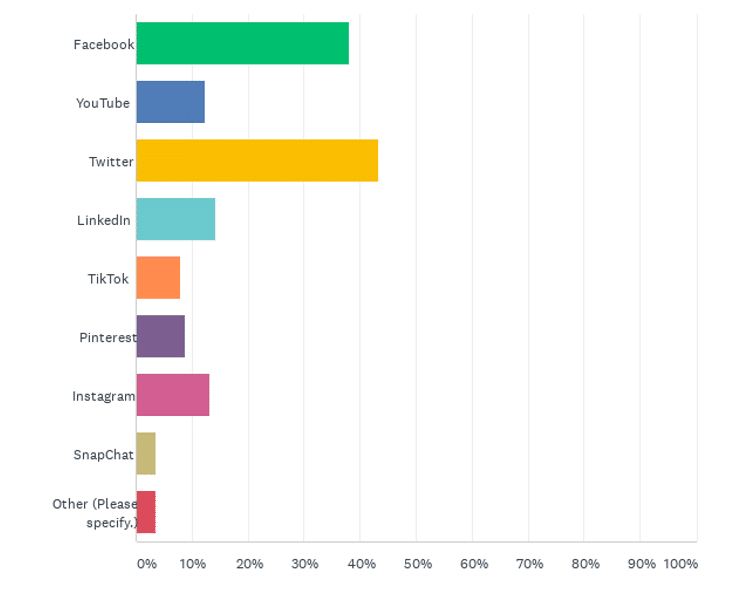
Fewer than 15% of survey participants chose other channels, including YouTube, LinkedIn, and Instagram. TikTok and Pinterest also received less than 10% of the vote each, likely because few respondents reported managing these channels.
Paid Social Statistics for Agencies
Is your agency using the best channels for social advertising? Take a look at the best and worst platforms for paid social.
Which social media channels drive the best paid results?
Although paid and organic social media strategies can bring completely different results, participants highlighted the same channels as top performers in both categories. About 75% reported that Facebook generated the best advertising results, while about 45% claimed Instagram generates the best return.
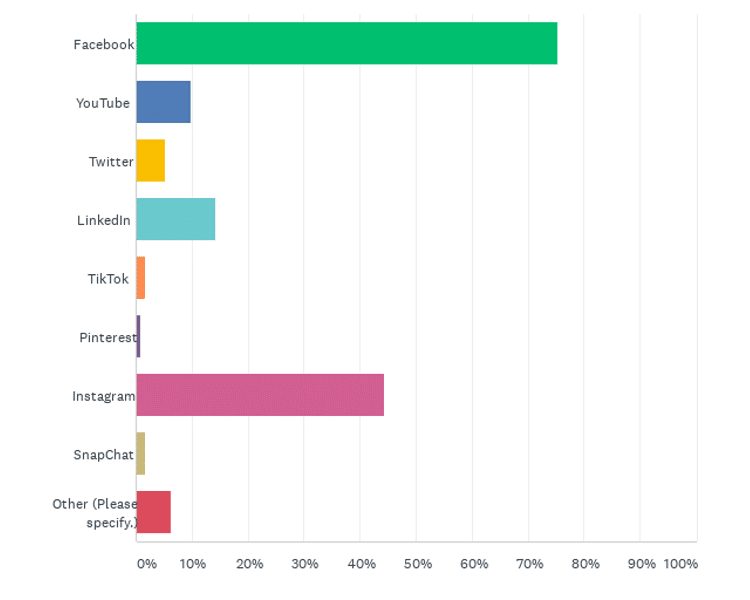
If you’re one of the many advertisers who has struggled to keep up with the ongoing changes to Facebook Ads, these results may surprise you. However, Facebook Ads have only gotten more popular with our survey participants in the past year. In our 2020 social media agency survey, only 60% of respondents reported that Facebook Ads drove the best results for their agency.
Which social media channels drive the worst paid results?
Twitter Ads received only 5% of the vote in our top advertising channels poll, so it makes sense that this platform ranks at the top of the worst performers survey. Nearly 30% of survey participants called out Twitter for the worst results from paid advertising, while LinkedIn Ads (25%) are a close second.
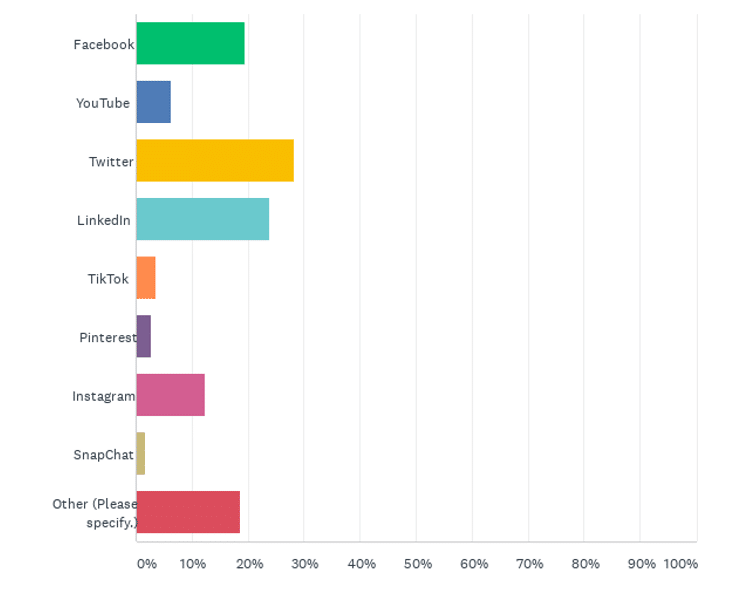
Facebook Ads and Instagram Ads received 20% and nearly 15% of the vote, respectively, but there’s a caveat. Several survey participants noted that Facebook Ads is the only paid channel they use, so this platform stands out as both the best and worst.
How Agencies Manage Social Media Content
Is your agency keeping pace with the competition, or is your team paving its own path? Find out what type of social media content agencies publish and how often they post.
How often do you publish social media content?
Deciding when to post on social media isn’t always easy. You have to strike a balance between staying on followers’ radar and getting blocked due to over-posting. You also have to be aware of typical recommendations for each channel.
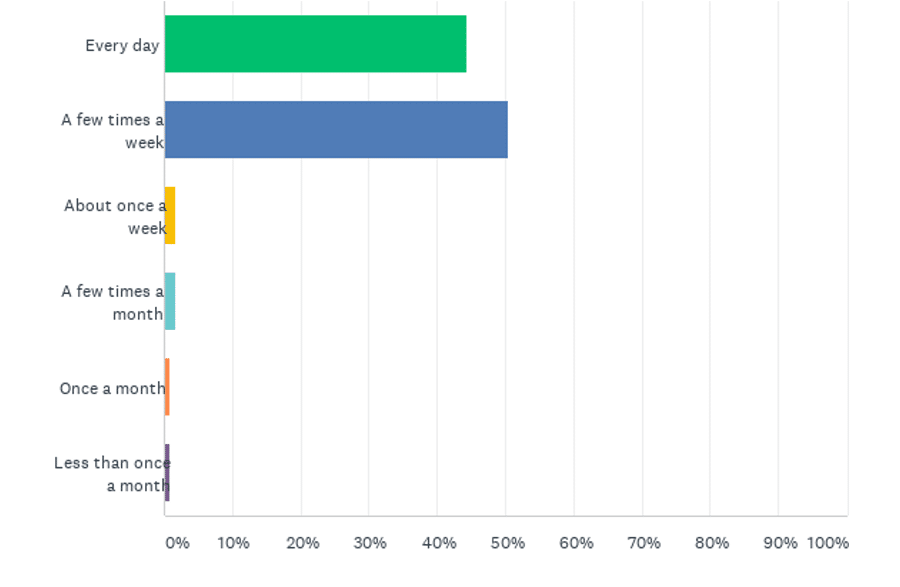
By and large, our survey participants stick to standard best practices. About 50% post a few times a week, while about 45% post every day. Very few (less than 10% total) post less often. In fact, only a handful post once a week or once a month.
What type of social content do you publish most often?
In recent years, video and live streaming have received a ton of attention, thanks to the increased engagement and reach they tend to generate. If the statistics hadn’t converted you, surely new features like LinkedIn Live or Instagram Reels would have.
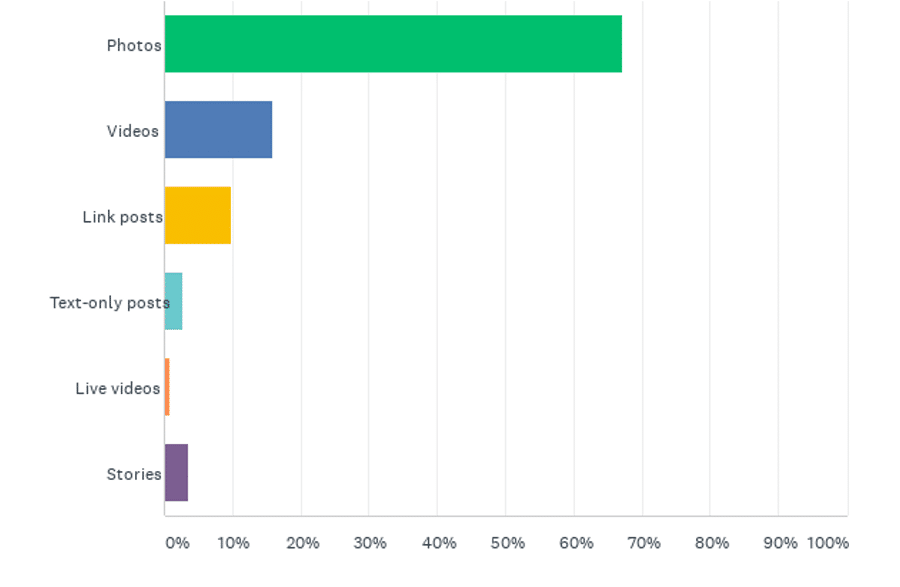
However, only 15% of survey participants reported that they publish video most. Less than 2% host live streams most. Instead, about 65% of respondents post photos most, and about 10% prefer links.
These results suggest that agencies have been slow to prioritize video. If your agency already offers video production, then helping clients drive better results from video could be an opportunity.
Primary Pain Points for Social Media
Does your team struggle with the same concerns other agencies have? Discover common agency pain points and get a better idea of how agencies are handling tricky areas like reporting and ROI.
What’s your biggest pain point?
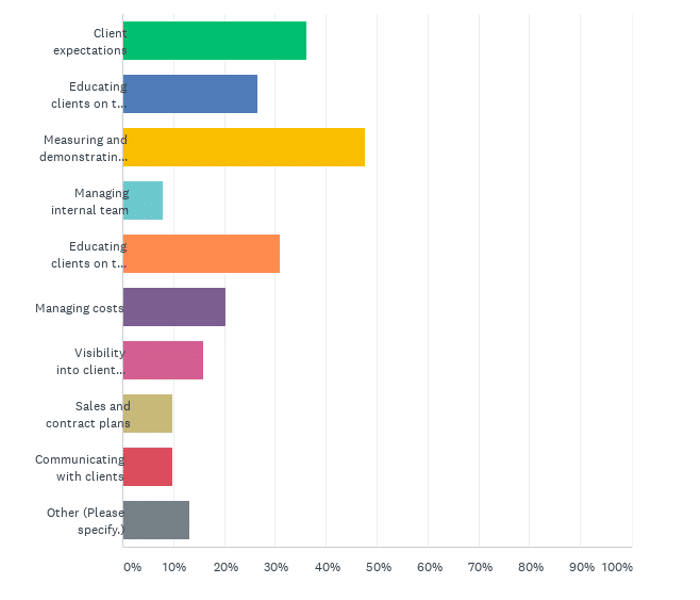
The top four pain points for our survey participants are all intertwined:
Measuring and demonstrating ROI: 45%
Managing client expectations: 35%
Educating clients on the value of social media: 30%
Educating clients on the value of an agency: 25%
Essentially, agencies are struggling to figure out how to measure the value they provide and set appropriate expectations. As a result, clients aren’t getting the message, ultimately failing to understand what the agency or social media approach can accomplish. If your team can convey what to expect from an agency and quantify results, you’ll have solved your competitors’ biggest problems.
How do you demonstrate ROI to clients?
Since many agencies struggle to demonstrate ROI, it’s not surprising that some participants responded to this question stating that they didn’t have conversions to measure. Those that do measure ROI focus most on top-of-the-funnel metrics like social media engagement (65%).
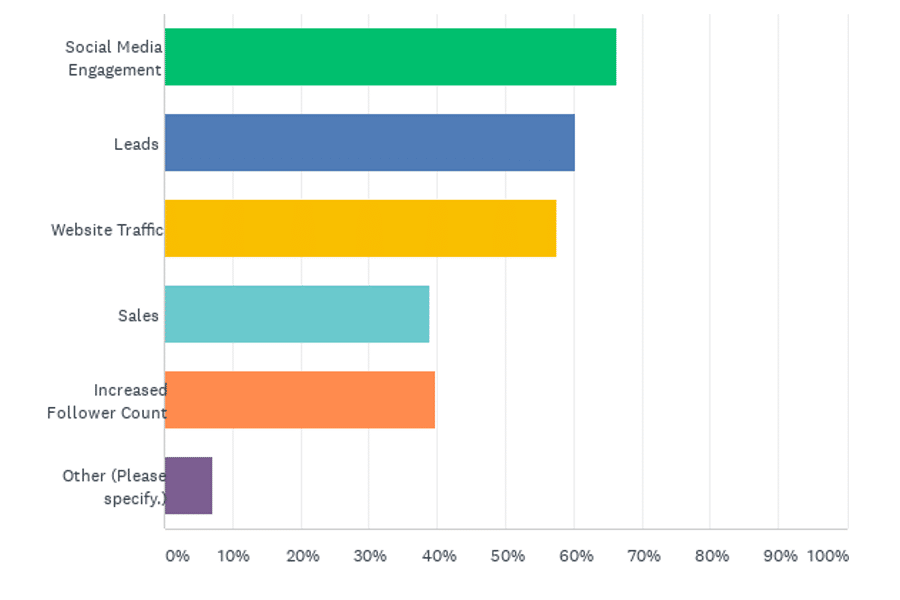
Many agencies also use middle-of-the-funnel metrics like leads (60%) and bottom-of-the-funnel metrics like sales (40%). Some also factor website traffic (55%) and audience growth (40%) into their calculations.
What data do you report to clients?
Most agencies report a standard set of metrics but adjust as necessary to incorporate unique client goals. Our survey results reflect that most agencies focus primarily on these results:
Audience growth
Reach and impressions
Social media engagement
Many also report on brand monitoring, competitive rankings, and top-performing content. Agencies that manage sales and leads report on these metrics. Likewise, those that manage paid-social report on metrics like:
Conversions
Cost per click (CPC)
Click-through rate (CTR)
How often do you report data to clients?
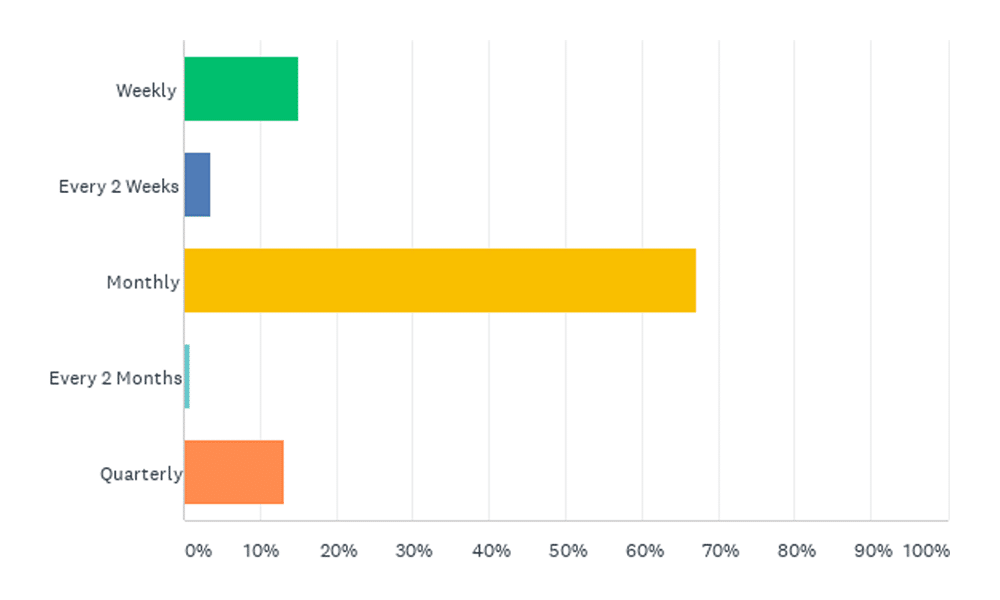
Monthly reports are by far the most common frequency for our survey participants, with nearly 70% using this timetable. About 15% provide more frequent reporting with weekly analytics. Another 15% provide less frequent quarterly reports.
Top Tools for Social Media Agencies
Could your team improve productivity or get better results with a more advanced tool? Check out the top tools for social media agencies.
What types of tools do you use for productivity or optimization?
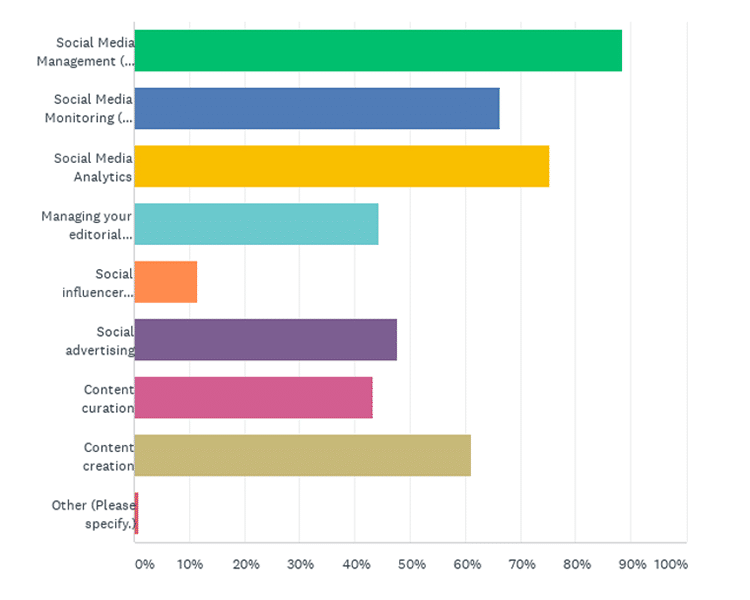
Since nearly 90% of survey participants offer social media management, it makes sense that social media tools dominate this poll. The most popular options for agencies include:
Social media management tools: 90%
Social media analytics tools: 75%
Social media monitoring tools: 65%
Social advertising tools: 45%
In addition, over 60% rely on tools for content creation, and 45% use an app to manage editorial calendars. About 45% also use an app to streamline content curation.
Do you use a social media management tool?
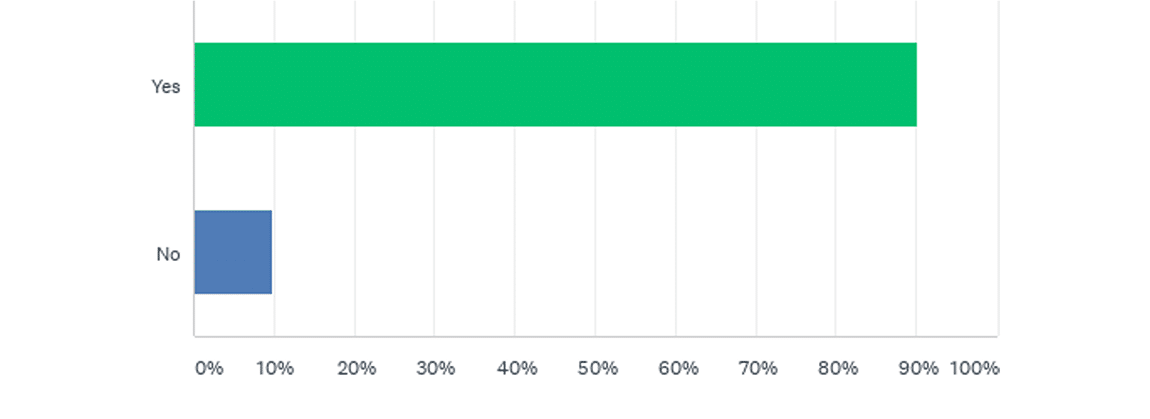
It’s no surprise that 90% of respondents confirmed using a third-party tool for social media management. Built-in tools can do much more than one purpose, from scheduling and engagement to social listening and reporting.
How Agencies Plan to Leverage Social Media in 2021
Is your social media strategy changing with the times? Or is your agency missing out on some key opportunities for growth? Take a closer look at what the competition is doing so you can plan effectively.
Have you changed your social media strategy in 2021 compared to 2020?
In 2020, brands and agencies alike experienced countless unexpected changes. From a massive shift to e-commerce to new advertising and engagement strategies, social media agencies had to pivot quickly.
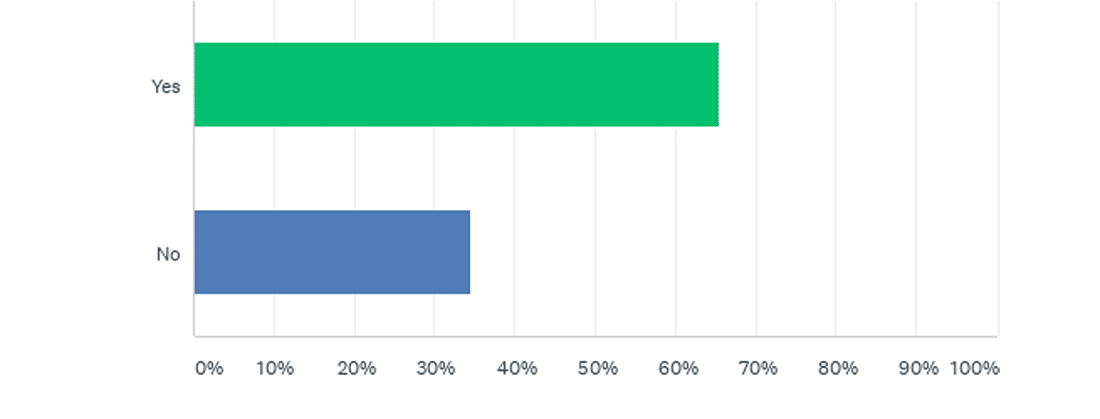
In 2021, our survey respondents anticipate even more change. About 65% indicated that they had already adjusted – or plan to adjust – their strategy in 2021. The 35% who don’t plan to change their approach may have already hit a groove.
Do you plan on doing more, less, or the same amount of organic social media?
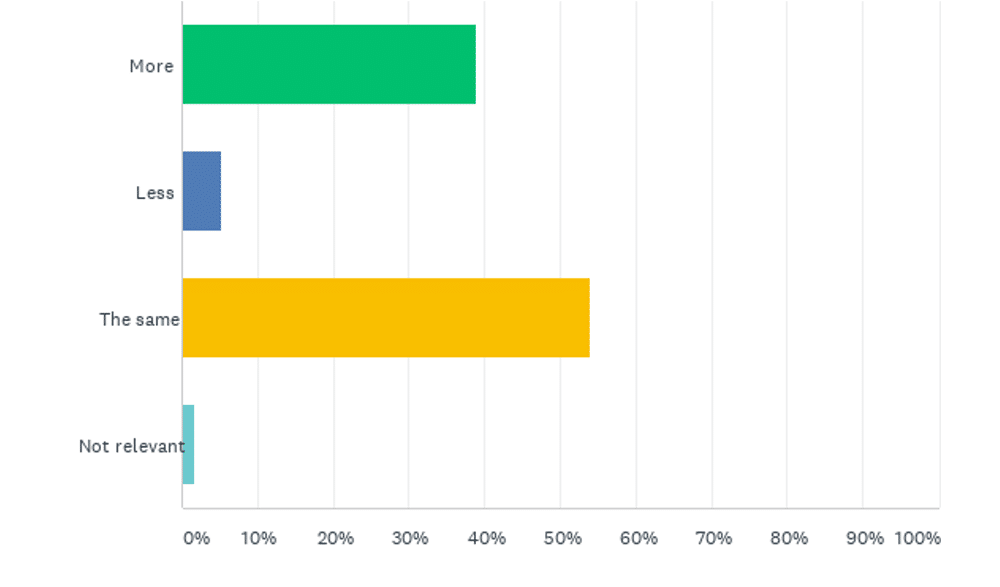
Interestingly, over 55% of participants don’t plan to publish more organic social media content, instead sticking with the same frequency. About 40% intend to publish more, and a mere 5% plan to post less.
Do you plan on doing more, less, or the same amount of social ads?
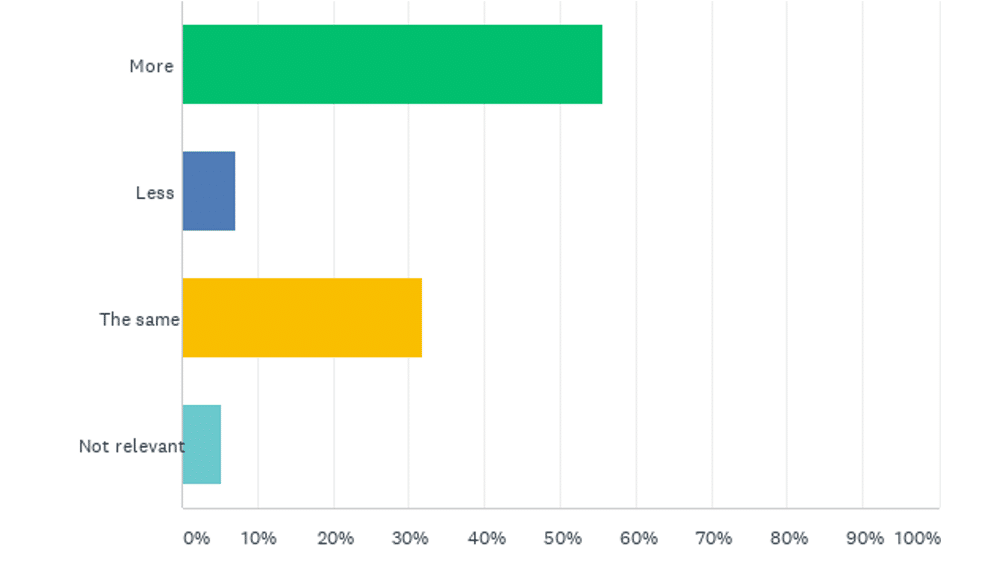
The 65% of respondents who indicated that they plan to adjust their strategy may have set their sights on paid social media. Over 55% reported that they intend to do more with social advertising in 2021. In contrast, just 30% plan to do the same, and less than 10% are aiming for less paid social.
Do you plan on doing more, less, or the same amount of Facebook Messenger marketing?
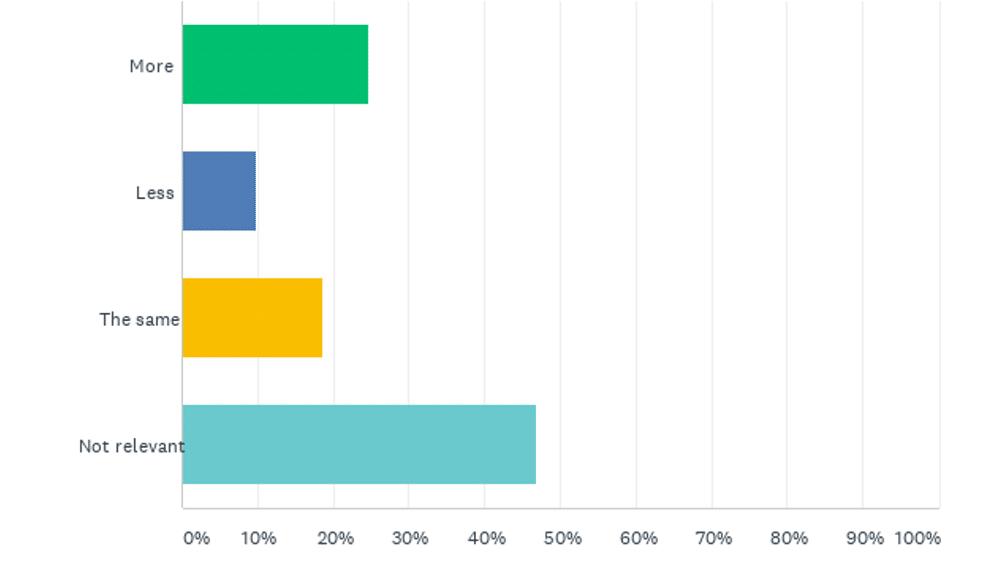
When we asked agencies about Facebook Messenger in 2020, 55% of respondents confirmed that they would be doing more of it. In 2021, the response rate has dipped down to 25%. Nearly 50% reported that Messenger marketing isn’t part of their social media management strategy, suggesting that interest in this platform may have fallen off.
Do you plan on doing more, less, or the same amount of posting to social media groups?
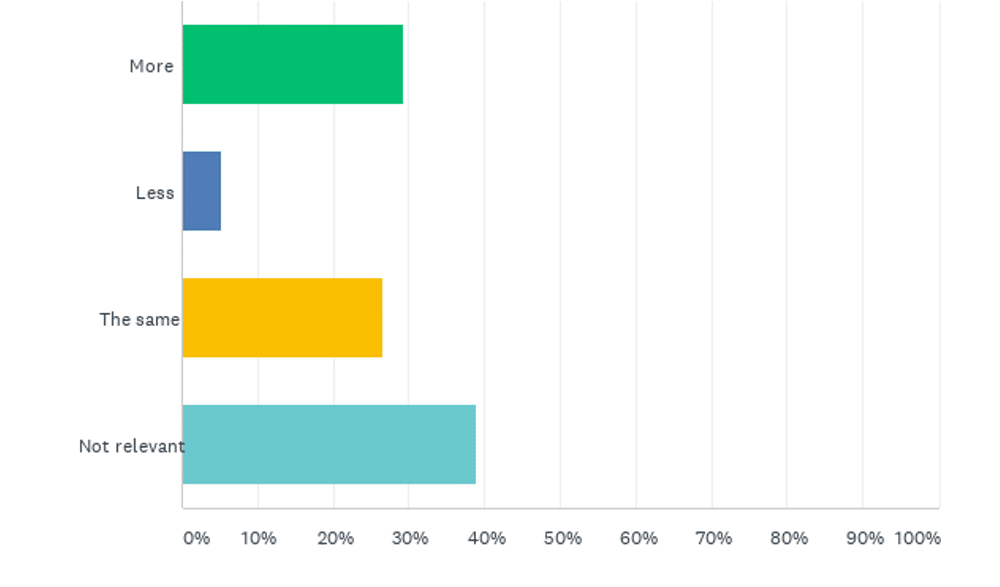
Although our survey participants have a generally more positive view of groups, most aren’t planning to do more posting in groups in 2021. About 30% responded affirmatively, while 25% indicated they plan to post the same amount. Nearly 40% reported that social media groups aren’t relevant to their strategy.
Do you plan on doing more, less, or the same amount of live streaming?
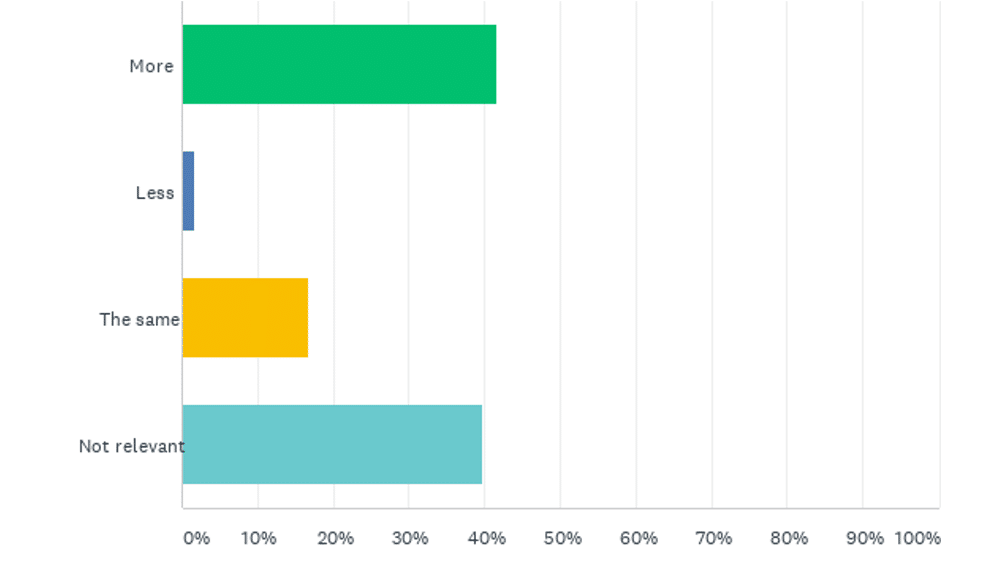
Compared to our 2020 survey, the 2021 results for live streaming are almost equal. Around 40% of participants plan to do more live streaming, while 40% don’t manage live streaming. These results suggest that agencies have a healthy appetite for live streaming, but many still aren’t leveraging this content type.
With these insights in hand, you can review your agency’s strategy and make sure your team can keep up with the competition.
Read more: agorapulse.com


