Bonus Material: FREE Agency Deck
Whether you’re doing social media reporting to your boss, your team, or your client, one thing’s for sure: You need to produce impressive reports.
In this article, I’m sharing some best practices for social media reporting that shines. That includes how to create them, present them, and what data to highlight.
As Director of Contentworks Agency, I often find myself presenting reports to agency clients. And their expectations are virtually identical to that of a boss.
Here are some of the most frequently asked questions:
Followers. How many new followers do we have? Are they engaged with our channel and content?
Content and performance. What content worked best on the channel? What was the ROI? How are our competitors doing?
Demographics. What are our fans interested in, where do they live, what is the age and gender? Any other insights you can give us?
Tailor Your Social Media Reporting
Each client is different, and their focus and aptitude for reporting are different too.
One of the first things to establish is how detailed a report should be.
Social media marketers, busy managers, and social media newies will want different levels of data, explanations, and hand-holding.
One thing is universal, though: Report recipients don’t want to search for information or dig for data.
They want to see key metrics immediately and understand how they tie into their social media KPIs. And there’s another thing to consider. Clients (and bosses) don’t have the time (or attention span) to read a huge report.
A recent study from the Technical University of Denmark suggests our collective attention span is currently at 8 seconds and narrowing because of the abundance of information presented to us.
A report will automatically calculate key metrics that you can export to PDF.
A basic report from Agorapulse includes:
Account growth
Audience demographics
Impressions
Content overview
Engagement
Community management
Best times to publish
Introducing Power Reports
I will be using Power Reports throughout this article, an add-on to the usual Agorapulse reporting.
Power Reports cost $29/month, which is added to your subscription plan. It’s the Rolls-Royce of reporting.
Power Reports allow you to:
Access multiple profiles at once for a combined social media report. Perfect for a social media agency:
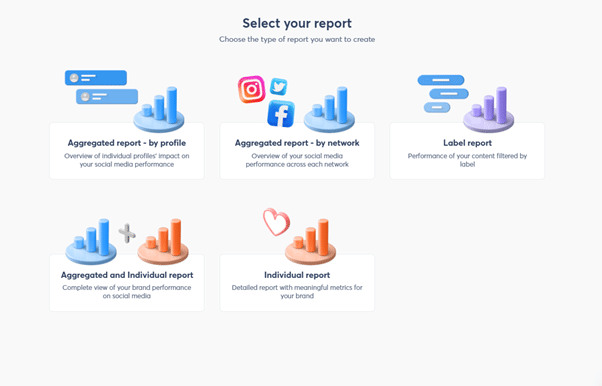
Example of Power Reports
Report with data from up to 10 social profiles in the way that suits you.
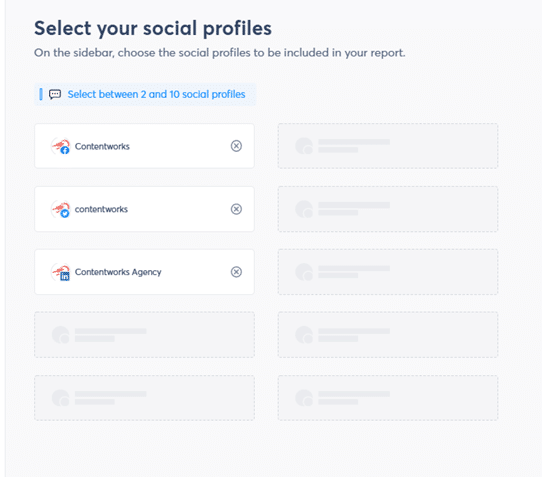
Social Profiles on Power Reports
Provide a combined overview for all channels. For example, the total audience for Contentworks Agency is 35K fans. Or you can choose a report that lists metrics for each channel separately. Data is presented in clear, colorful blocks that are easy to immediately understand.

Aggregated overview
Choose the aggregated data that matters to you (unselect the metrics you don’t want to see)
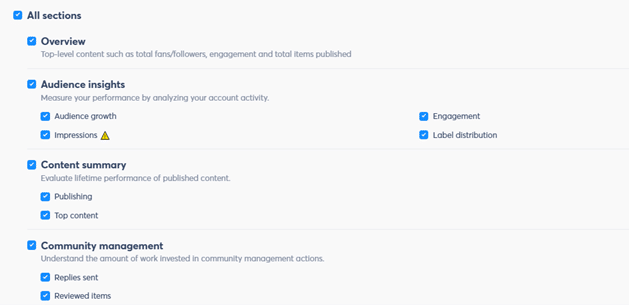
Schedule the reports to go out each week or month without you having to log in and activate them. These reports also can be sent out to external users, such as clients.
Shows you the top-performing content for each channel. That is essential information for marketing departments that want to gain valuable insights and content marketing direction.
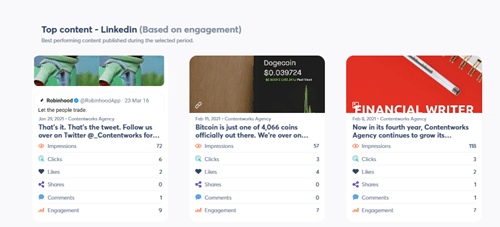
Customize the report for a professional agency feel by adding the logo of your agency or your clients.
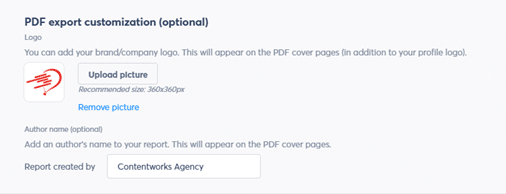
Optional PDF export customization
Agorapulse reports download in beautifully designed PDFs that you can send directly to clients.
I would, however, attach them to a cover email highlighting and explaining key data or successes. Alternatively, you can add a sheet at the end for your highlights or notes.
To include this additional information, insert extra pages in your PDF report or export all your metrics as a CSV so you can sort and format as necessary.
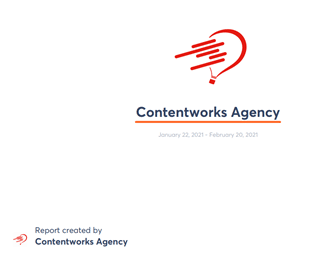
Check out how great the report front cover looks below. You, too, can add your client’s logo and name to really add the wow factor.
1. Social Media Reporting: Showcasing Followers
Social media managers tend to be less excited about followers than clients and bosses. That’s probably because we know this metric is not especially indicative of performance.
I’ve also met plenty of clients who purchased followers for their channels, so it’s not an accurate number. That said, the change in followers since you began managing the account is something to highlight.
Follower comparisons
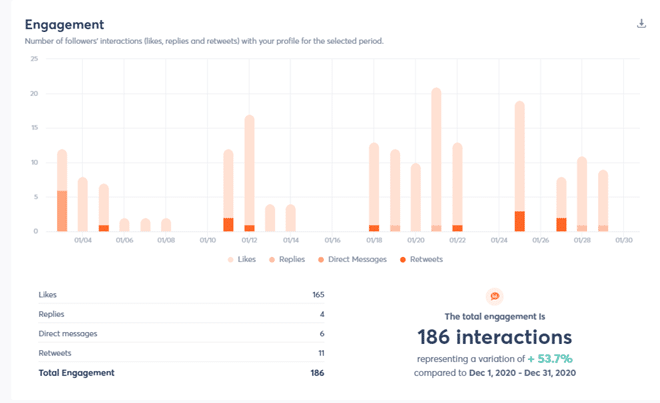
Below is a Twitter comparison report for a real client at our agency. We began managing the client’s Twitter account in January 2021. You can see that followers are up 20% and engagement up 53.7% in one month.

That won’t always be the case, and there’s no need to hide data that shows a decline. Instead, look at why that might be, what changed and how you can improve going forward.
Engagement
Below is the Twitter engagement for that same client. This is an important metric to highlight as it shows how clients engage with the brand.
We can see that on the day we uploaded a funny GIF, there were 16 likes and 3 retweets.
Engagement stats
Ad account comments
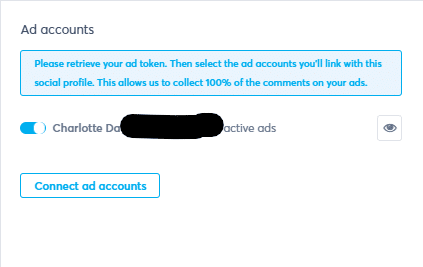
Remember to add any ad accounts to ensure you see comments and engagement for your paid efforts. This will give you a clearer overall picture.
2. Social Media Reports: Content Analytics
The performance of your content is a key metric for social media managers. Content includes posts, tweets, videos, GIFs, and images.
Bonus Material: FREE Agency Deck
Here are some of the areas your report should highlight:
Publishing
It’s important to show how many posts have been published on the channels you’re managing. That is an indication of how active you are and can again be compared with previous periods.
Below is an aggregated view of content on Facebook, LinkedIn, and Twitter in January 2021 as compared with December 2020.
As you can see, 8.9% more content was published in January. The total of published items is 317. You can average that as being over 10 posts per day across the channels, which is impressive.
In your content metrics, you can also note down the best time to publish content based on when your users are online.
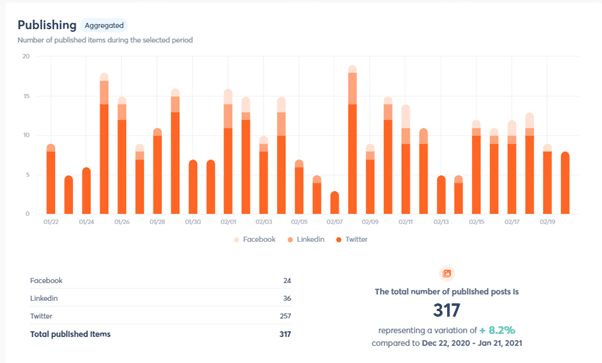
Publishing stats
Top Content
Showing your top content by engagement is a great addition to your report. This metric shows how many people the content reached, the number of engaged users and how many clicks it got.
You can list your top content by a channel, which also illustrates your multi-channel content strategy.
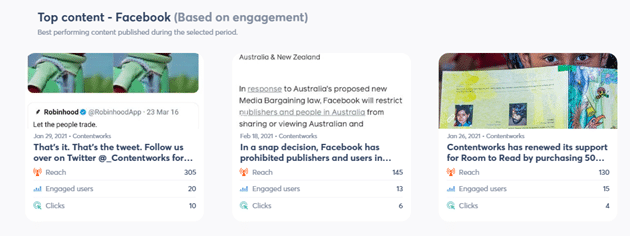
Stats on specific social media channel
If the content was paid, for example, a Facebook post boost, then you will want to equate the clicks with purchases and CPC (cost per click).
Your client or boss doesn’t need a huge printout from your Facebook for business account. Instead, just isolate the reach, cost per result, and overall spend.
If your link was tracked (ideally, it should be) you can also tie this into your Google Analytics reporting.
Your social media reports shouldn’t take hours to read. Keep them simple.

Label Reports
You can use the Label Reports features of Power Reports to:
Track the success of your marketing campaigns
Generate tailored reports for any stakeholder
Inform your marketing strategy with additional data
Create as many labels as you need for up to 5 social profiles.
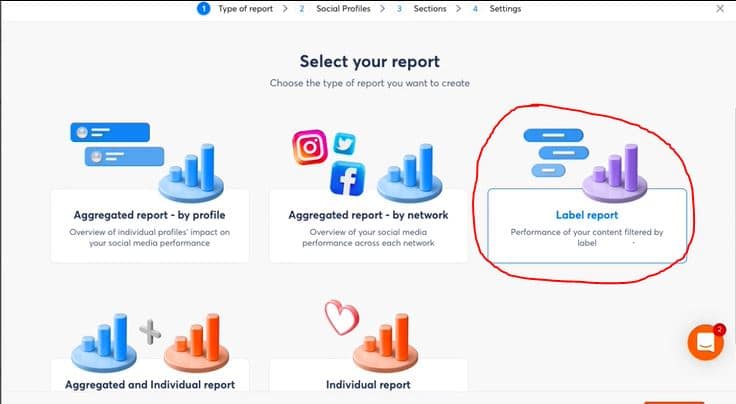
Label your Power Report
You’ll then be able to see all the results of your social media campaign and details you need.
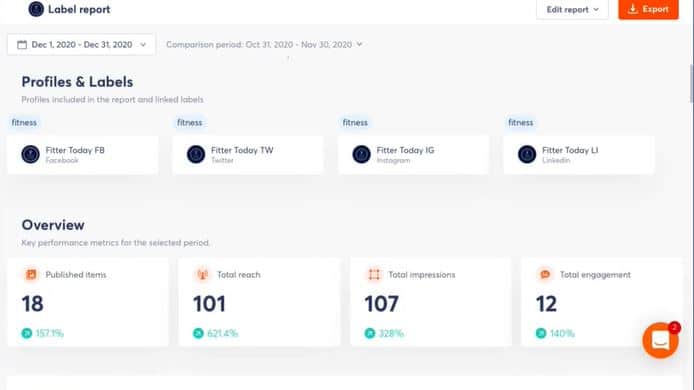
Results of your Power Report
Hashtags
Hashtags are part of the content you use on your channels and should form part of your social media report.
Fortunately, Agorapulse aggregates your popular hashtags and displays them by popularity in a word cloud.
Doing so allows you to see and explain how hashtags impact engagement and conversations on each network. This is a super-useful feature if you plan to run a campaign or create a branded hashtag. It will isolate the engagement for that hashtag showcasing its reach.
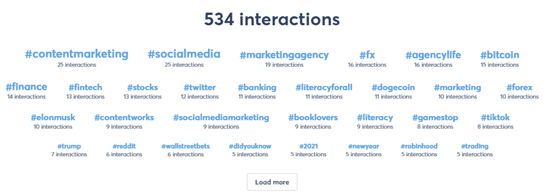
hashtag word cloud
In your email overview, list your best posts for the month. Emphasize whether they are organic or paid and elaborate on why they were so successful. Let them know that you used great hashtags or piggybacked on trending news.
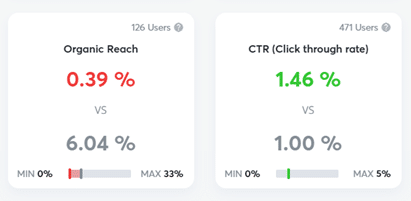
Reporting tip: You can benchmark key metrics like reach, engagement, and negative feedback against the average page’s performance via AgoraPulse Barometer.
You can even choose to compare with pages of a similar size to yours for a realistic result. Facebook Barometer is free, so give it a try!
3. Social Media Reports: Digging Into Demographics
Getting to know a brand’s demographics is a fun part of your reporting. It’s also a section likely to interest recipients who are marketers.
Knowing your audience is key to creating targeted content that gets clicks and wins business.
Here are some demographics you can access via Agorapulse reporting:
Seniority and position
Seniority and position is a great social media insight to report.
For example, company bosses often assume that Instagram is for kids,but that’s not the case at all.
In fact, 33% of internet users between the ages of 30 and 49 use Instagram. Furthermore, 42% of those making more than $75K use Instagram.
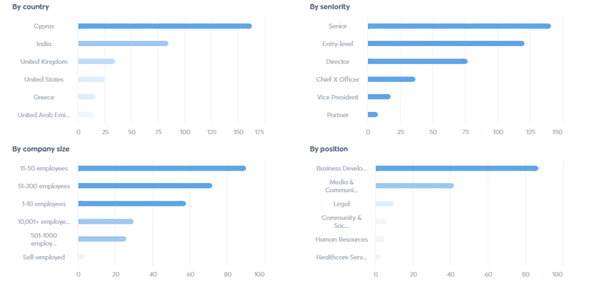
As you can see from the screenshot below, most of Contentworks’ followers are in senior positions from companies with 11-50 employees and hold the title of business development. This is great reporting data to share with clients.
Online Presence
When are your followers online? This is useful data that should already be informing your social media strategy.
If a client asks why your posts are going out at 6 AM, that’s why! Remember that posts should be in your target audience’s time zone, not yours.

More Detailed Data
You can access more detailed page demographics data in each social media platform, especially if you’re running ads.
The analytics bar on LinkedIn, for example, will provide detailed insights by location, job function, seniority, industry, and company size. This probably isn’t necessary for every report though.
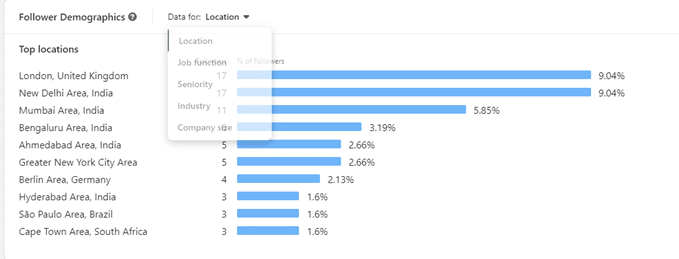
As a social media manager or agency with access to demographics data, it’s up to you to report on this and make suggestions for future content.
Similarly, if you see that one channel is performing much better for your demographic than the others then you can make suggestions on diverting time and budget there.
Wow Factor Reporting Tips With Power Reports
Punctual reporting
Always produce reports at the same time each month. This is not only important for data presentation but also for client expectations. We produce reports at the end of each month for social media clients.
Problem areas
Not everything on your report must be about wins. Go down this road… and eventually, you will find yourself hiding negative data, which isn’t ideal. Bullet point any problem areas, poor content, or hashtag fails. This will help you and the brand to avoid them in the future.
Content ideas
At the end of your report, suggest content ideas for the month ahead. Show that you are using a content calendar and are aware of any events that may be suitable for the brand. You can also add tips and suggestions at the end.
Stay KPI-focused
If your client has explained their KPIs to you, or you helped them strategize then it’s important to show you are aligned with them. Keep the client’s core KPIs filed and make reference to them in each report.
Make suggestions
If your reporting shows that videos and GIFs perform well, suggest your client makes more. If you can be specific on the type of video that got the most engagement, it can be replicated for the future.
Share a competitor campaign
Saw a winning campaign from a competitor? Screenshot it along with some engagement data. This shows you’re watching the competition and ready to go head to head.
Compare customized comparison dates:
Compare time periods beyond the standard “last month” or “last 7 days.” Thanks so this custom option, you can show specific information on how your team is performing.
Bonus: Use label reports to show the performance of specific campaigns.
You can create specific reports for your social media campaigns using Label Reports.
In Conclusion
Enjoyed reading Best Practices for Creating Social Media Reports That Impress? Go ahead and hit share.
Get started on saving time and energy on your own social media management! Check out our free trial of Agorapulse to help you schedule, track, and measure all your social media efforts.
Read more: agorapulse.com


