[ad_1]
“This wasn’t built for marketers.”
“Why did they make this so difficult?”
“I can’t find my reports.”
“Who asked for this??”
I hear these things when I talk to people about GA4, the new version of Google Analytics. The tone is pure dread.
But it’s also a tone of urgency. GA4 launched in October 2020, giving us years to learn it. But most marketers waited. Some are still waiting. But the July 1st deadline is fast approaching
I started using GA4 about a year ago. To learn it, I meet weekly with Dan Baran and Amanda Gant. We got help from Kyle Akerman. Together, we’d pick a question we could answer using Universal Analytics and replicate it in GA4.
Gradually, I stopped using UA to answer those questions. Eventually, I made the switch completely and I’ve finally come to realize…
GA4 is better than Universal Analytics.
You may disagree. It seems most people do. I reached out to a lot of friends who use Analytics and they ALL disagreed, for different reasons. You can read their feedback below.
So why don’t people like GA4?
The most basic reason is that the UX is different. Things have moved, and at least at first, it’s not intuitive. What used to be available with one or two clicks, now takes more configuring. This video shows the GA4 vs UA comparison side-by-side.
In GA4, everything is there and more. But it requires some setup to find things. Here’s a simple way to think about it:
UA is like IKEA
Universal Analytics was always a template-based tool. The menu on the left was a pile of 100+ reports, some of which gave answers and insights without too much configuring (adding segments, secondary dimensions, advanced filters, etc.).
GA is like Home Depot
You build the reports as you go, picking the dimensions and metrics that get you to your insight. You can build reports that would be impossible in Universal Analytics, but it requires more skill. It’s a power tool.
Clearly, there are quite a few answers to the “How is ga4 different from universal analytics?” question, from what is tracked to how the reports are managed. GA4 is more for the Analytics power user doing deeper analysis.
If you like reporting, UA was great. Just click on a report.
If you like analysis, you were configuring your UA reports anyway. For years, you’ve been picking primary and secondary dimensions then filtering/segmenting those dimensions to get to your best insights. So the switch to GA4 is natural.
GA4 vs. Universal Analytics: What is tracked?
Assuming you have enhanced measurement turned on (it’s in setting in Admin > Data Streams) GA4 tracks all kinds of things that aren’t easily tracked in Universal Analytics.
It’s possible to track these in UA, but it requires much more skill to set things up. In GA4, you can just toggle them on.
- Engagement Rate
No one is complaining about this. It’s a far more useful metric than Bounce Rate, which true Analytics pros never liked. A bounce is simply a one-page visit, even when that visitor stayed for 30 minutes and dropped their email address into your pop-up window.An engaged session is any visit longer than 10 seconds, more than one page or with a conversion recorded. Now that’s a meaningful metric! - Video engagement
Did the visitor play a video? Which video? How much of that video? GA4 will report on all of this for you, at least for embedded YouTube videos, with no fancy setup required. Not so with Universal Analytics. - Scrolling
Did the visitor scroll down the page? GA4 reports on this, at least for scrolls down to the 90% page depth, without any special configuration. UA doesn’t. - File downloads
Whenever the visitor clicks a link that brings them to a downloadable file, an event is triggered in GA4 (file_download), at least for files with these extensions: .pdf, .xls, .xlsx, .doc, .docx, .txt, .rtf, .csv, .exe, .ppt, .pptx, .zip, .avi, .mov, .mp4, .mpeg, .mp3, .wav …and a few othersIt’s possible to track file downloads in UA, but you need to set up an event in Google Tag Manager, which isn’t super fun. - Outbound link clicks
Did the visitor click to leave the website? From which page? Which link? Tracking exit clicks is easy in GA4. That’s because the “click” event has a “Link URL” parameter. No special setup required, unlike Universal Analytics. - Site search
Did the visitor use your site search? What did they search for? This is tracked in both GA4 and UA, but in GA4, you don’t need to do anything as long as your query parameter is q, s, search, query or keyword. In UA, you need to turn this feature on, then find and enter your query parameter.
GA4 vs. Universal Analytics: How are reports managed?
This is the main reason why marketers grumble about GA4.
Yes, it takes more clicks to get to certain insights. You build the reports as you go, which is more flexible, but also more work. This isn’t the only frustration:
- GA4 has no annotations, at least not at the time this article was published (April, 2023). This is a big gap and a problem for a lot of us. Google, if you’re reading this, please consider adding this to GA4.
- GA4 reports don’t let you change the trendline charts. You can turn them on or off, but that’s it. Filters and comparisons don’t affect the line charts. Want a line chart showing just search traffic? You need to build it as an exploration. Not super fun.
But the improvements to GA4 are big:
- GA4 Funnel Explorations are better than the UA Funnel Visualization Report. That UA report only showed pageviews (or “virtual pageviews” if you have a few hours to figure that out). Now with GA4, you can build a funnel with any event as a funnel step. Brilliant!
- No more views. That means no more wondering if you’re looking at the right “View.” Views were often abused and lacked any standards for management. I’ve seen accounts with 12 UA properties with a total of 55 views, all for one website. Which one of these am I supposed to look at?GA4 won’t have this problem of configuration creep. Just make the reports you need when you need them.
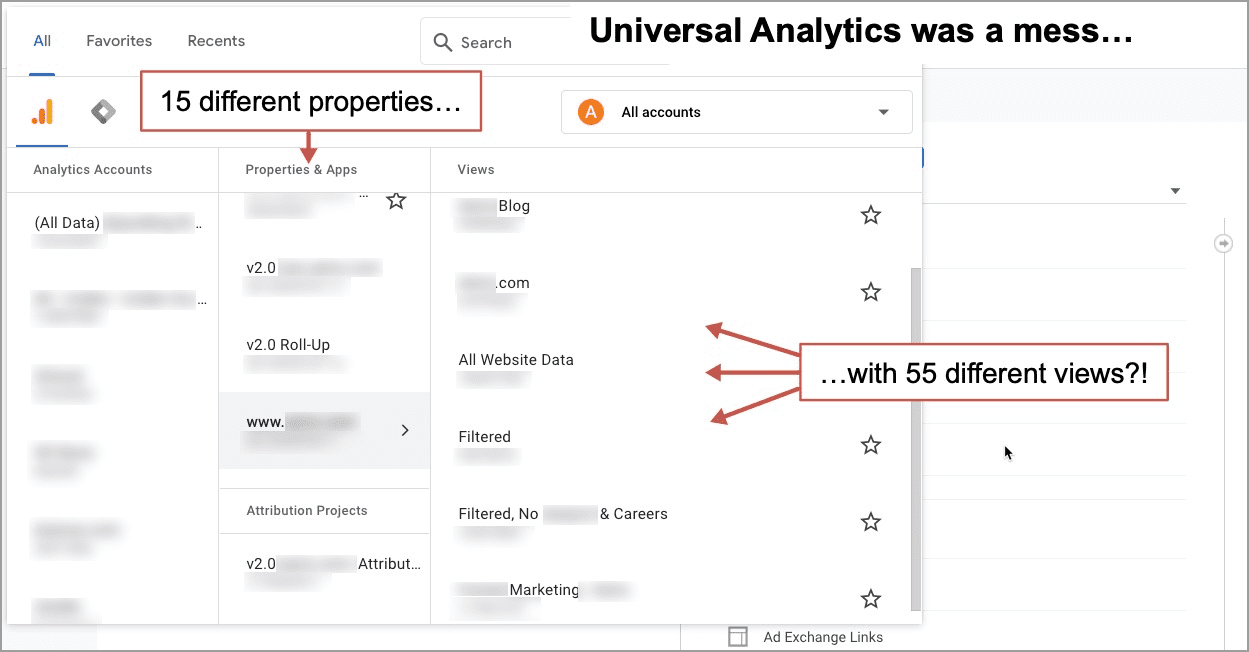
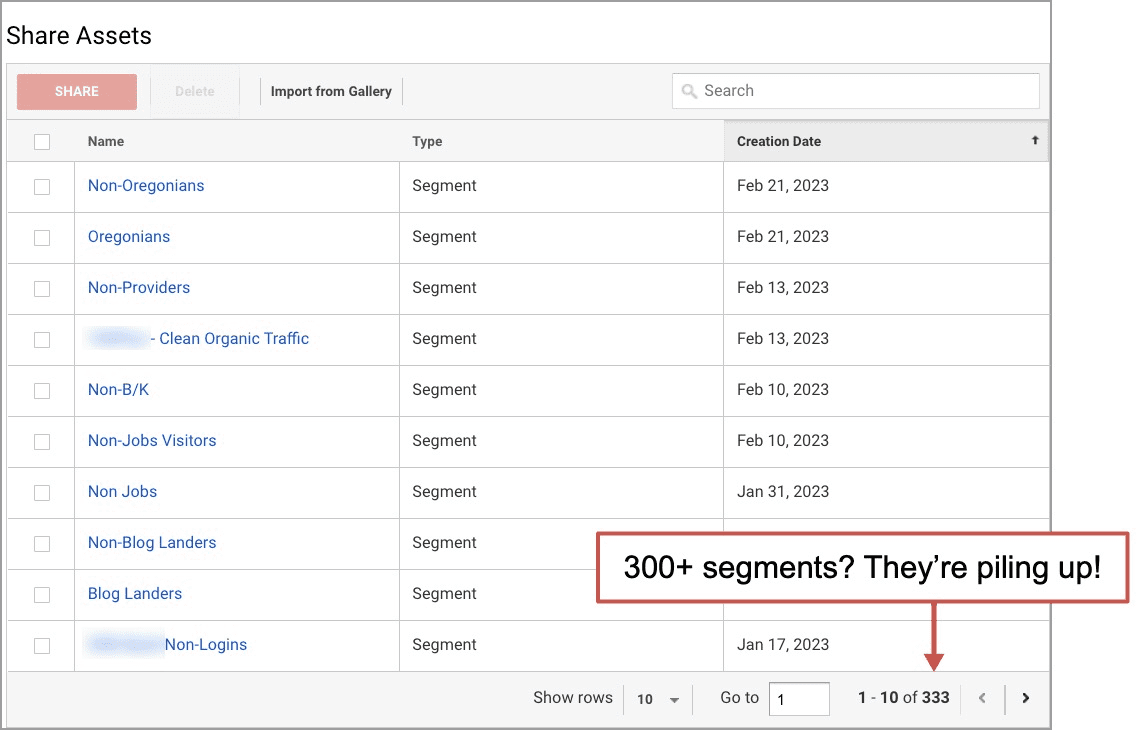
- No more saving of segments. It seemed to make sense until the day you realize that every segment you’ve ever created is saved, along with every dashboard and custom report. It really makes sense to just make them as you need them.
GA4 Explorations are better than all those UA reports
Explorations replace a lot of separate things in Universal Analytics, including custom reports, funnel visualizations, reverse goal paths and navigation summaries. Now all of the fancy reports are in one place.
Once you’re up the learning curve, building explorations is pretty quick. Think of explorations as something between Google Analytics reports and Looker Studio. Explorations are more powerful than GA reports but easier than full dashboard building tools.
Here’s an example. This exploration shows the conversion rate for mobile and desktop visitors who came from organic social vs paid social sources. Fun, right? You can’t do this in Universal Analytics. But it only took minutes to build in GA4.
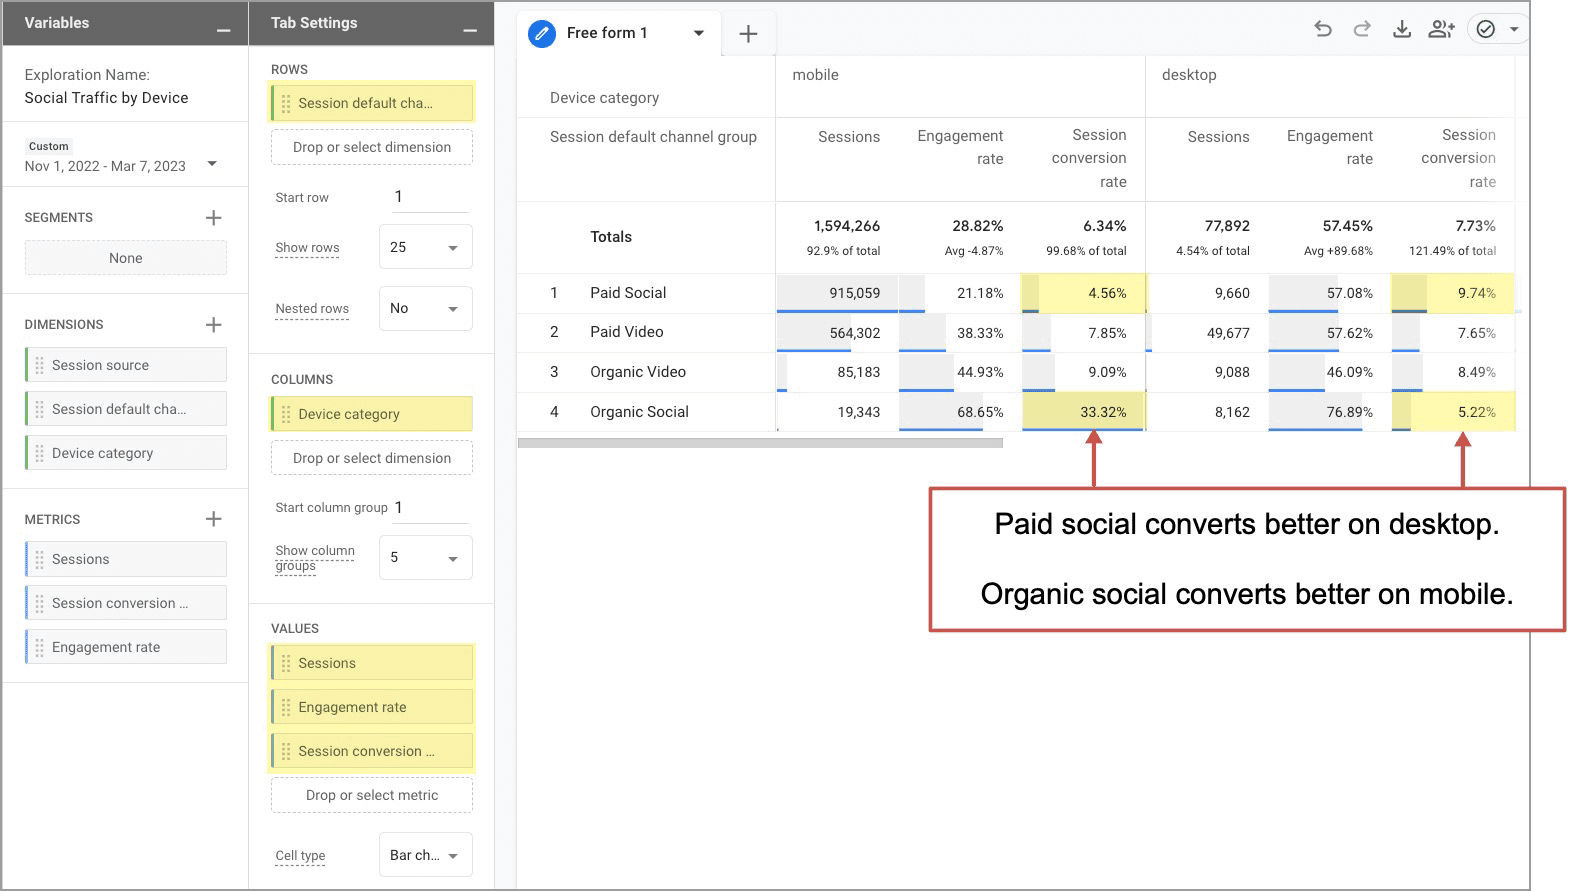
You could probably build this GA4 exploration yourself just by copying what’s in this screenshot. Add the dimensions and metrics by clicking the + sign, then drag and drop them into the rows, columns and values boxes.
Easy peasy lemon squeezy!
But annotations are missing from GA4.
This is a problem.
Universal Analytics made it easy to add notes under the trendlines. Redesigned your site? Paused your PPC campaign? Added a conversion? Changed cookie consent settings? Article went viral? Add a little note! UA let you add annotations right into Analytics so everyone knows what happened on that day.
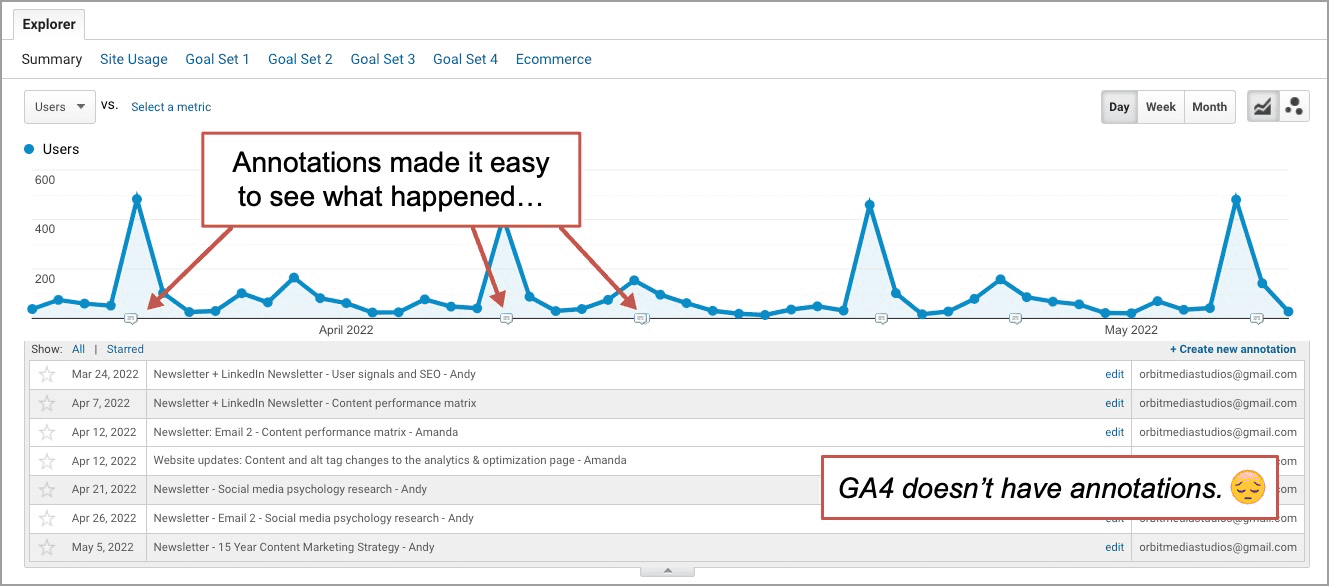
In GA4, there are no annotations. So we all have to use something else to start tracking website changes, Analytics changes and other changes to our marketing.
A lot of people are resorting to spreadsheets to track website changes, Analytics setup changes and marketing changes. Spreadsheets aren’t fun, but it’s important to have these all listed in one place.
GA4 vs. Universal Analytics: Data Retention
This is an even bigger problem.
Maybe the worst thing about GA4 is that it will only track 14 months of data. And that’s only if you change the Data Retention setting from 2 months to 14 months. Yes, 2 months is the default setting.
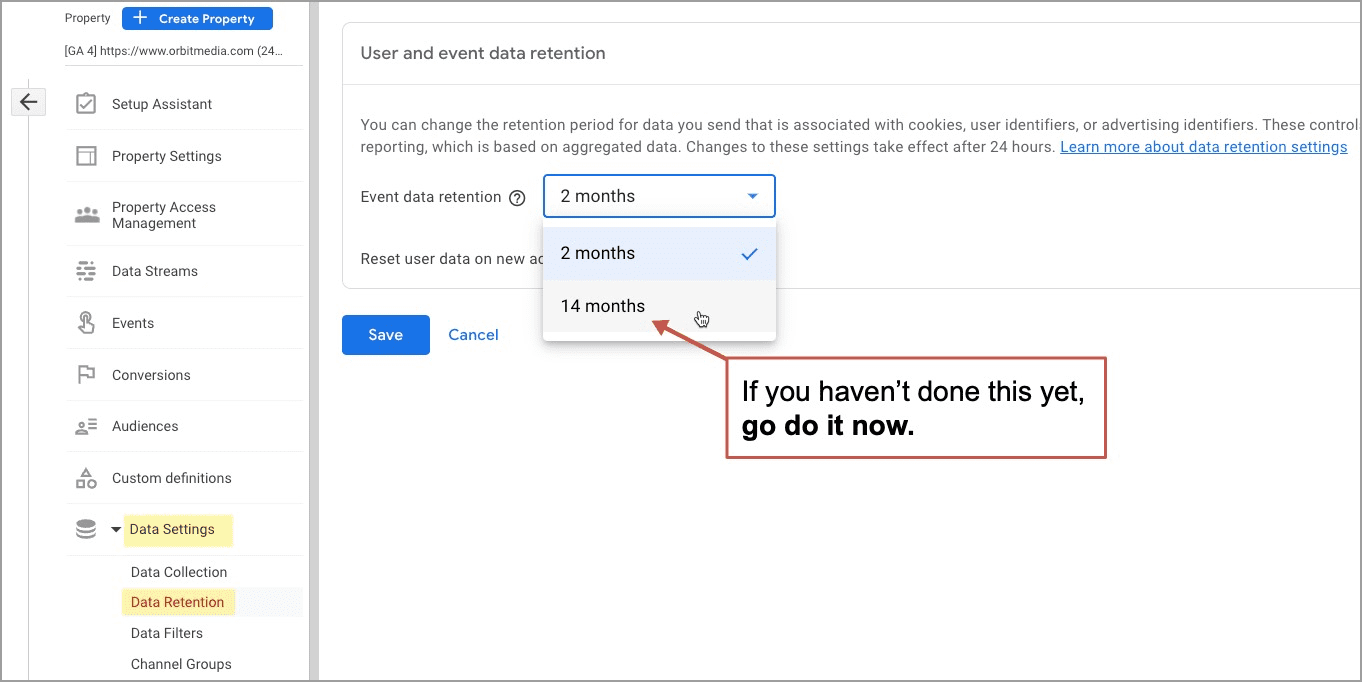
If you haven’t yet, go to Admin > Data Settings > Data Retention and set it to 14 months.
If you have friends that haven’t don’t this yet, contact them now.
Everyone needs to do this immediately.
Then what? What about data older than 14 months? You can get it out of GA4 and into BigQuery, where you can do Analysis in other tools such as Looker Studio or Tableau. But that requires even greater technical skill.
This is the biggest difference between GA4 and UA in my view. It’s fundamental, not cosmetic.
GA4 vs. Universal Analytics: Events and Conversions
Finally, we get to the main difference in the underlying technology.
- GA4 is event-based. That means everything that happens on your website is tracked as an event.
- UA was primarily pageview-based. By default, it tracked movement from one URL to the next.
Yes, the “data model” is important, but it doesn’t have a direct impact on the day-to-day life of the marketer. You can do your reporting and analysis just fine, either way.
But there is one key way in which the data model matters: how goals and conversions are set up.
UA made setting up goals super simple. Just add the URL of the thank you page. That’s a destination goal. Visitors who touch that page converted.
But in GA4, you can make any event a conversion. Just toggle a switch and the goal is set up.
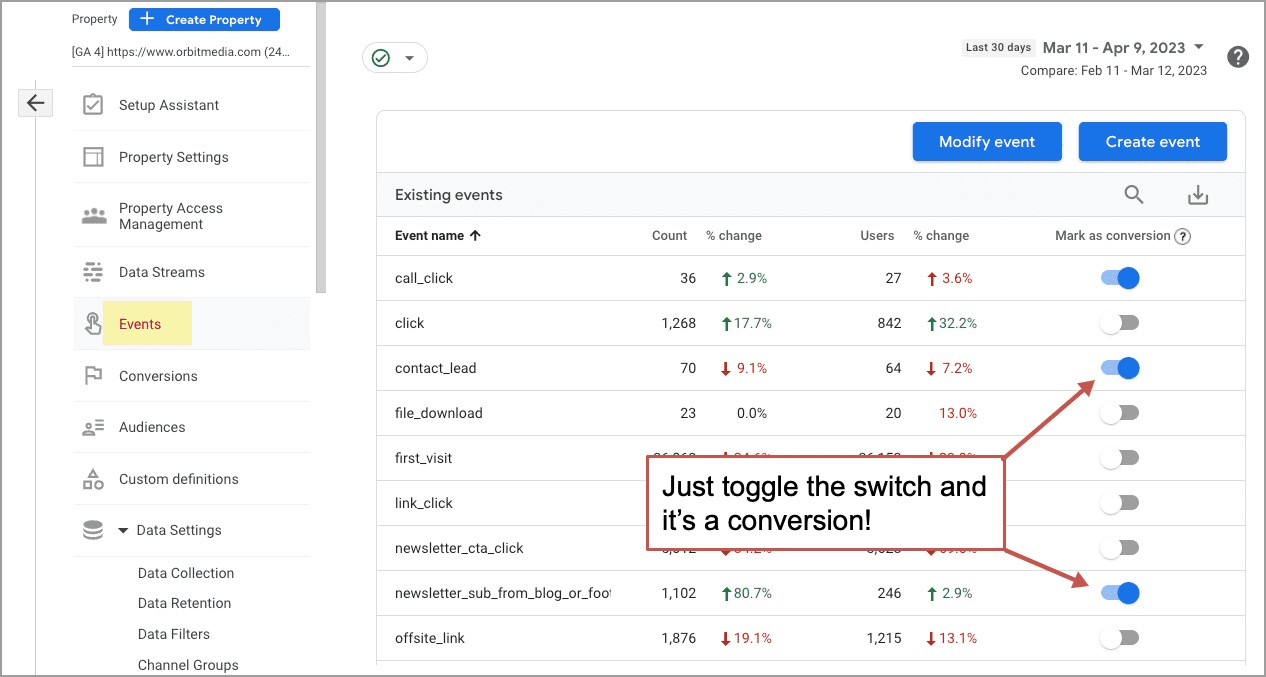
This is better because it’s more flexible. Any event can be tracked as a conversion. But it’s worse because it’s often harder to set up. You may need to first create the event. Then you need to wait for the event to be triggered so it appears on this list. That might take a day or two! Finally, you toggle the switch.
What do marketers think of GA4?
Let’s check in with some marketers who use Analytics routinely. We deliberately asked users of Google Analytics, but not people who specialize in it. Power users who are immersed in GA4 have a unique perspective. They’re not typical digital marketers.
So here are 11 digital marketers who have been using GA4. We simply asked them: What do you love and/or hate about GA4?
Scan through and you can hear the frustration, see the alternatives and remind yourself that you’re not alone.
 |
Mike King, iPullRank“GA4 is basically an alpha product that Google is acting like is ready for primetime. It’s missing core features and functionality that we’ve come to rely on from years of having UA and it’s requiring us to essentially relearn much of the product from scratch. If it wasn’t free, I think more people would be switching to something else. Instead, we’re all just waiting until the last minute to learn it and many of us will be crying about not having year over year data in a few months. Not that it matters since years haven’t really been comparable since 2020.“ |
 |
Justin Rondeau, InvisiblePPC“I really feel like GA4, at the time of writing, is an incomplete product that is going to further alienate analytics professionals from business objectives. With any release of a software project, there are going to be bugs, features being worked on, etc…At GA4’s scale this is even more inevitable. But where the product is now it seems like Google’s goal to push GA4 on the market is out of alignment with what the market actually needs: an approachable way to measure and track performance. Analytics and data have always been a dirty word in marketing and with this update it’s going to make that an even dirtier word – doubly so for the folks that get burned during the forced migration in July. When businesses stop having faith in their data, then they’re going to start losing faith in the discipline and that will have a longer standing impact in the analytics industry as a whole. So what do I love about GA4…not a whole lot at the moment. What I HATE about GA4 is the roll out process and how it’s going to impact the progress made to make companies become less “data scared” with a technology that looks less approachable. Oh and for crying out loud…let me group my damn data by day, week, and month easily. I just want these buttons back!”
|
 |
John-Henry Scherck, Growth Plays“I don’t hate it… but it’s pretty coarse grain and clearly designed to sell BigQuery credits and turn the marketing products into an additional revenue driver for Google Cloud while not providing a lot of additional value. It’s definitely not an upgrade. Not being able to hold historical data past 14 months is a tell. Honestly, at the end of the day, I’d rather use a product like heap.io if I’m trying to understand user behavior and how a visitor becomes a lead.” |
 |
Amy Higgins, Amy Higgins Consulting“I love the simplification they did with the home page. However, when digging deep into the data, they took away a few of my favorite, tried and true pathways. It’s an easy learning curve to adopt GA4 if you’ve never used it, but teaching old dawgs new tricks will take some time for adjustment.” |
 |
Court Wakefield, Children’s Health“Like anything, there are pros and cons to migration to GA4 from Universal Analytics (the Universal Analytics burning platform is a big one). Unfortunately, given Google’s recent response to HHS’ HIPAA compliance memo, Children’s Health will need to migrate away from Google Analytics altogether to implement a fully HIPAA-compliant platform such as Piwik.” |
 |
Alex Birkett, Omniscient Digital“I love it for me, but it’s a headache for most of my clients. For analysts, it’s a much better system. But for many marketers and website product managers, it’s a lot more hassle to set up. In a recent podcast, JJ Reynolds and I came up with an analogy to describe the difference between GA4 and Universal Analytics. Universal Analytics is like Chipotle; quite customizable if you know what you’re doing, but limited to an extent, and with great starter options. GA4 is like going grocery shopping; you first need to know what you’re making in order to assemble the ingredients, but ultimately, you can make anything you want. So in summary, I think GA4 is annoying for most use cases, but for advanced users, it’s a much better model.“ |
 |
Zontee Hou, Convince and Convert“Because GA4 shakes up the paradigm on how data is organized, the learning curve is steep and there’s a lot of setup that needs to be done by organizations to make sure they get what they want out of the tool. Google has made top-line data easier to identify with its suggested “Insights,” giving novice users the impression of ease of use. But to get deeper insights out of the tool requires more advanced setup and time invested. I don’t hate the new tool, but I do think it will be a painful process for most folks to adapt to this new way of understanding website behavior.” |
 |
Brian Massey, Conversion Sciences“It’s love/hate. It is clear that Google, for all of it’s brilliance, does not know how to sell software products. It’s trying to use its BigQuery cloud tool to charge for analytics access. It’s doing this by limiting the ability of its other tool, Looker Studio (formerly Data Studio) to access the free version of GA4. This means that we have had to become experts in BigQuery, purchase a “caching” tool called Analytics Canvas, and boost prices to our clients. It also means that we are seriously considering recommending an analytics package other than Google’s to our clients. Once Google figures out what it is doing (it just changed its BigQuery pricing model) we’ll see if they are still a leader in analytics.” |
 |
Shazhou Liu fitzpatrick, Shopify“Cons:
Pros:
In summary, while there may be some initial challenges in adapting to GA4’s new data model and transitioning from Universal Analytics, we should invest time in understanding how to configure and work with GA4 to maximize its potential.” |
 |
Alexandr Khlopenko, Brightvision“What I love and hate about GA4 is the same thing – even after a couple of years, it’s a half-baked (but high-potential), user-hostile (but extremely flexible) product that can’t decide on its audience (so it doesn’t put itself in any corner). Riddled with contradictions, GA4 has been a source of frustration since we started rolling it out to our clients almost two years ago. Switching to an event-based focus was a godsend, but on the other hand, Google expected us to set up most of the events ourselves (even considering the expanded video and engagement tracking capabilities). The UI and thus UX in GA4 suck. All the reports and insights that we used to consider default from day one were gone, or worse – hidden away, and you would need to read a 3000-word article to find them. Once again, Google expects you to set up all the stuff you need yourself. If you’re a small business owner who doesn’t need a data analytics agency and can’t hire an in-house specialist, that’s a terrible blow. For us, it was a great opportunity to prepare tailor-made exploration reports for our clients instead of interpreting and reinterpreting what they saw in standard pages and user flow reports in UA. To avoid their UI, we prefer to export all our data to third-party tools, which seems easier than before until you find out that not all dimensions and metrics can be exported/exported correctly and that you need to keep in mind that there are data limit quotas. For us, relying on a BigQuery warehouse may not be that big of an issue, but once again, for a small business owner, it could be a dealbreaker. Lastly, no one knows how long GA4 is here to stay and how invested we all need to be. This uncertainty is exacerbated but lack of real alternatives to GA4. In essence, as with all their products, Google gives and takes away.” |
So why are we all complaining about GA4?
Because it’s different. And we don’t like change.
But if you use it, you’ll get used to it. And you’ll forget how frustrated you once were. Just think back on how hard it was to learn Universal Analytics. That was hard once too.
Maybe this will help…
Learn GA4 the same way you learned UA: by using it. Answer each of the questions below using your own data. Start by stumbling around. Watch a video. Try. Fail. Try again and you’ll get it.
I counted the number of clicks necessary to find each answer.
- What’s the difference in conversion rates for mobile vs. desktop visitors?
Answer in 10 Clicks - Which PPC landing page has the lowest conversion rate?
Answer in 15 Clicks - What percentage of visitors to the contact page fill out the form?
Answer in 6 Clicks - Are visitors who watch videos more likely to convert?
Answer in 28 Clicks (use an exploration) - Which of our highest traffic articles have below average engagement rates?
Answer in 10 Clicks - Which pages are sending visitors to the contact page at the highest rate?
Answer in 12 Clicks - What percentage of homepage visitors scroll to the bottom?
Answer in 4 Clicks - Traffic from which social networks are the least engaged?
Answer in 9 Clicks
Sure, it takes practice. But that steep learning curve only makes the skill set more valuable.
Learn it and they’ll think you know magic.
You’ll be the magician in meetings.
They’ll ask you questions and you’ll pull data out of your hat.
[ad_2]
Source link

![GA4 vs. Universal Analytics, The Side-by-Side comparison [VIDEO] Plus, Input from 10 Angry Marketers](https://wildfireconcepts.com/wp-content/uploads/2023/04/ga4-vs-universal-analytics-1.jpg)


