
[ad_1]
Data-driven product management. That’s what the cool kids do nowadays, right? You might have googled and found out that being “data-driven” is about the extensive usage of product analytics in the day-to-day workflow of these product managers.
But the question is, what do they do with the analytics data? How do they use it in real life?
Luckily, I have compiled a list of 6 use cases for product analytics to inspire you.
What Are Product Analytics and Why Should You Care About It?
Product analysis is the process of gathering data about your digital product (including user activity, financials, etc.) analyzing it, and making day-to-day and product strategy decisions based on your findings.
The usage of product analytics significantly increases the quality of decision-making that you do as a product manager, as you are able to support and prove your ideas or solutions with the use of data.
As quantitative data, it is also complementing the qualitative data that you have gathered with customer interviews, giving you a complete picture of the state of your product as well as customer behavior.
You can enable product analytics for your product by setting up a specialized product analytics tool that monitors the activity of your users and sends you reports about user interactions.
These tools will then aggregate the user action data they have gathered from your product and let you build custom reports to find answers to some of the questions you might have about the usage of your product.
Now that we know what product analytics are about, let us begin exploring some of the practical cases of applying product analysis.
Example #1: Decluttering Your UI From Features That Nobody Uses
Great products are not the ones that have more features than their competitors. In fact, most of the time, products with too many features become hard to navigate for their users and impossible to maintain for their product development team.
Therefore, great product teams ensure that their products only have features that add value to their users. To do this, you will always be adding new features that you think people will use and getting rid of the ones that you know are not valuable anymore.
The next obvious dilemma is how to choose the features that are worth removing. It’s simple; check their usage with a product analytics tool!
Using An Event-Based Product Analytics Tool Like Mixpanel For Decluttering
To be able to track the usage of any feature, you will need to set up an event for it and fire it whenever the user interacts with that feature. Assuming that you have set up these events for the product features that you want to measure, all you need to do is create a report on the usage of that feature.
Let’s illustrate this with an example. Imagine you are leading Spotify, the music streaming service that many of us use, and you would like to understand if it is worth getting rid of the shuffle feature.
For this, we will create a new Insights Report that looks like this.
Here, we have selected our feature in question – “Shuffle” along with the baseline feature (usually your product’s core action or North Star) that we want to compare it with—in this case, “Stream a Song.” For both of them, we have selected the “Count DAU” option to show us the number of unique users who perform shuffle and stream every day.
We have then added a simple formula that calculates the percentage of song streamers who have used the shuffle feature.
By looking at this chart, we can come to 2 important conclusions:
- Barely 0.5% of all music streamers are using the shuffle feature.
- The usage of shuffle has been steadily declining from 1.3% to 0.5% in the last month.
Based on these usage statistics, we can consider Shuffle a worthy candidate to remove and declutter our UI.
Example #2: Finding And Fixing User Experience Issues That Break Your Setup or AHA! Moment Flows
The first steps that your users take in your product will have a strong impact on their retention and lifetime value. At least, this is what I have seen numerous times on the products I have led.
Any improvement in the process of users setting your product up and reaching their AHA! moment would eventually convert to a higher level of retention for them.
For clarity, users reach their setup moment when they have done all the necessary configurations when signing up (e.g. providing credit card details and verifying it on a payments app). The AHA! moment is the point in the user journey where they first experience the benefit and value of your product (e.g. making an instant transfer with your payment app).
It is usually quite common to have product experience issues in the journey that results in fewer people reaching their setup and habit moments. But the good news is that you can easily find them with an analytics tool.
How To Use Product Analytics Funnels in Heap For Troubleshooting Conversion
One of the most practical ways of tracking and troubleshooting journeys (including those that lead to your setup and AHA! moments) is the funnels. A funnel is a list of events placed in a specific order where you can see the conversion of users from one event to another.
Here is what a funnel analysis looks like for a basic signup page where you have a single email field and a submit button.
For our signup page, we track users for these events:
- Signup page view.
- Fill in the user email in the field.
- Click on the submit button.
As we can see, there were 1,200+ users who entered the Signup page. However, only 17% of those 1,200 have filled in their email, and 90% of those who gave their email have clicked on the submit button.
This funnel is telling us that there is something wrong with the email field and we need to investigate what exactly it is.
For this, we can either do usability testing of our signup screen or view the Heap session replay, which is the real-time video recording of the user’s interaction with your product.
In the case of the email field, you might find out that the email validation is frustrating, and your users give up after trying to input their email a couple of times.
Example #3: Measuring Feature Impact During the Gradual Rollout
How many times have you added a new shiny feature to your product that was an utter failure (as in, did not improve usage, or even hurt it)? This has happened at least a couple of times to even the most talented PMs.
As we don’t always know if the feature we have built will succeed or fail, it is a good idea to roll it out to a small number of users, check if they use it (and if it improves your key metrics like retention or lifetime value)—then, assuming that it was a success, roll it out to everyone else.
You can perform both the gradual rollout and impact measurement with a specialized product analytics solution like Amplitude.
Setting Up And Running Experiments With Advanced Product Analytics Software Like Amplitude
Amplitude comes with advanced functionality called Experiments. You can use it to either run A/B tests or to do gradual feature rollouts. I will not get into the details of creating an experiment, as it is a story for another day, but you can check out the documentation that Amplitude has for its feature that describes everything from API messaging to integrations, notifications, and pricing.
Now let’s imagine that you have added a video guide as part of your product onboarding, and you want to increase the number of people who click on play and watch it. For this, you have designed two solutions with the video appearing in two different parts of the onboarding.
To understand if your solutions work (and which one works better), we can set up an experiment, with a partial rollout of 25% for variant A and 25% for variant B.
When we start this experiment and run it for a while to get statistically-significant user data, this is what we see.
The chart above is a conversion funnel from home page visit to video start. As we can see, variant A is the winner and it can optimize the conversion of video start by 3.4%.
Depending on the situation, you might consider this either a success or a failure. For a conversion rate of video open, I’d say this is a fail and it is not worth the hassle to deploy to everyone. But if the result of an experiment was a 3.4% increase in retention, that would be a significant success.
Example #4: Monitoring Product Health
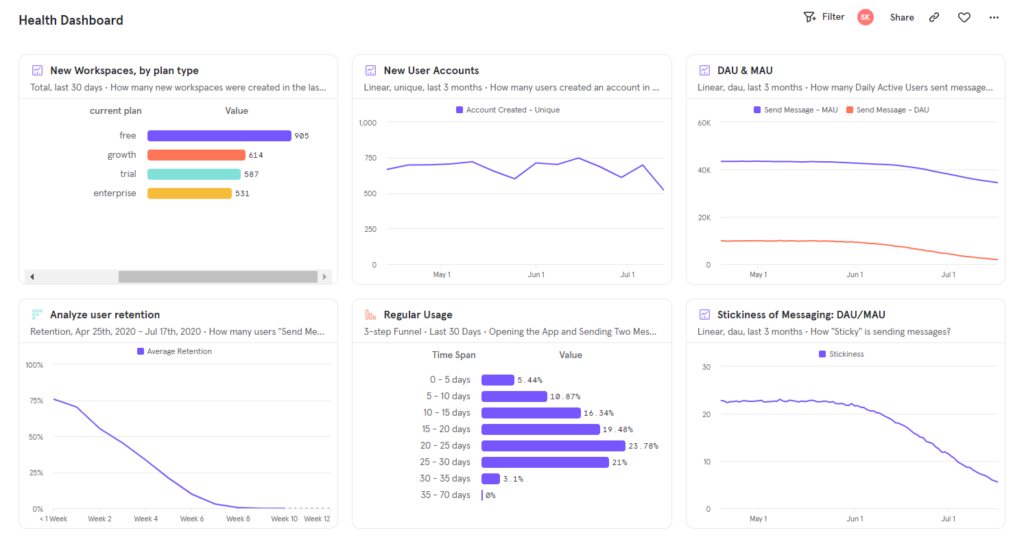
Products are living organisms that can feel well or become “ill.” To make sure that you are always aware of the health of your product and that you are able to identify and fix any issues with it, you will need to monitor the “heartbeat” of your product in the form of a product health dashboard.
As a result of your monitoring, you might notice dips or peaks in the core product metrics and KPIs like WAU or stickiness that need investigation, or you might see that your user engagement is gradually dropping – signaling you that your product needs a refresh.
Luckily, a product health dashboard is something that you can make with ease using any business intelligence tool (e.g. Mixpanel or Amplitude).
Tracking Core Product Metrics With Mixpanel
Dashboards in Mixpanel consist of multiple related reports that you put side by side. For a product health dashboard, you can consider creating the following reports:
- DAU, WAU, or MAU for your core action (e.g. streaming a song for Spotify). Your choice between those three depends on the natural frequency of the core action. For song streaming, it will be daily, thus, your choice will be on DAU.
- Stickiness (DAU/WAU, WAU/MAU, etc.). This will show the percentage of users who are engaged and return back to your product.
- Signups over time and Free → Paid conversions over time. You want to keep an eye on these two and make sure that they are gradually growing.
- Churn. This is the number of users that you have lost over a period of time. The increase here should get you worried.
- Retention. This is showing the number of users who have stayed with you after a specific amount of time (e.g. 90 days).
Here is what a typical product health dashboard will look like in Mixpanel.
You are free to add any other additional reports to your dashboard if they represent the health of your product.
Example #5: Making a Ship/Don’t Ship Decision When Your QA Team Has Found A Serious Issue On The Release
One of the harder product decisions that we need to make is giving a green light for the release to ship. And it is hard because releases are almost never free of bugs. Things become even more complicated when we find a bug that is capable of hurting your customer experience.
But why is it complicated? If you have a nasty bug, then you should fix it first before releasing it, right? Well, imagine that you find out that it will take your team another week to fix it and your marketing team has already made commitments and preparations that are painful to break.
In this situation, you have two choices:
- Give a green light to the release and face the consequences of the nasty bug.
- Give your marketing team a strong argument why they should postpone the launch.
Both options look bad. But don’t worry, as there is a chance that the bug in question will have a much smaller impact than you imagined and you can ship the release without many consequences.
To measure bug impact, we can use data from our product analytics platform.
Using Google Analytics For Calculating Bug Impact
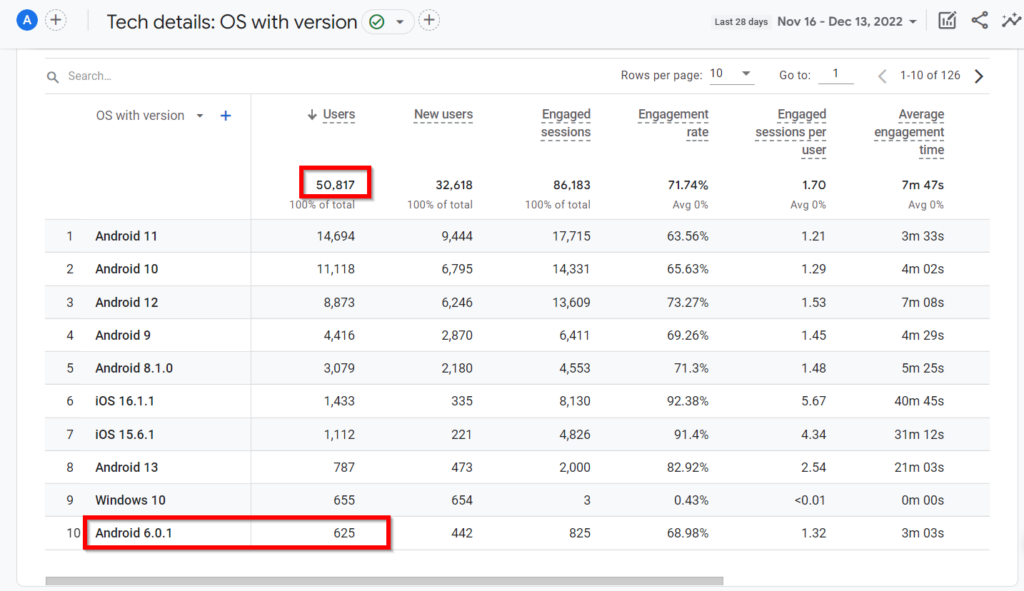
Imagine that you have a bug that is causing occasional crashes for your mobile app on Android 6.0.1 that completely breaks your customer journey. To understand the impact of this bug, we will need to know the number of users that have this version of Android.
Luckily, apart from usage data, Google Analytics is also capable of gathering and storing data on the technical aspects of our users, such as their device types, OS versions, screen sizes, etc.
So, if we open its “Tech details” report and select the “OS with version” option, we will find out that only 1.2% of the entire user base is on Android 6.0.1.
Although this data is already an indicator for us to give a green light for the release, we can go a step further and also calculate the potential financial impact by checking the revenue we get from Android 6.0.1 users.
If we run a comparison for the total revenue between “all users” and “Android 6.0.1 users”, we will see the following.
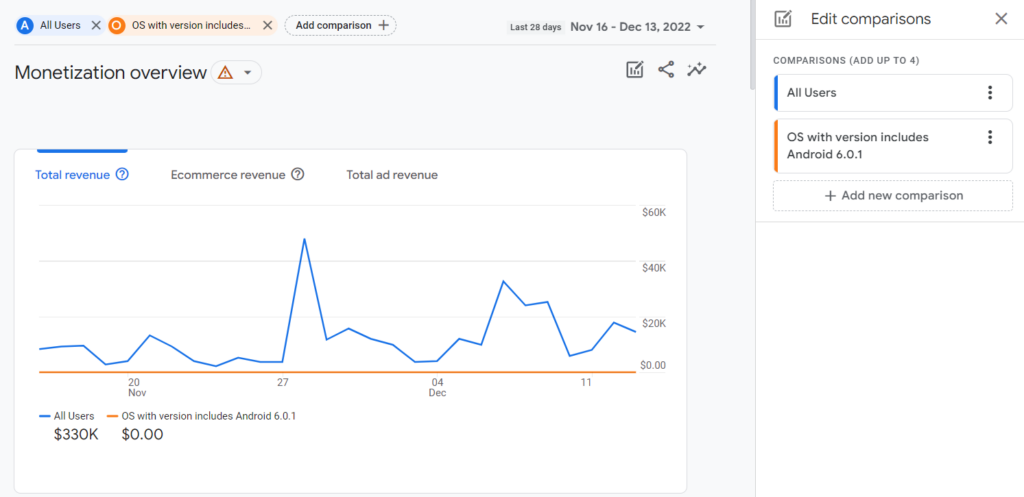
Apparently, the users who will face crashes after the release earn no revenue for us. Therefore, we will have no financial consequences from releasing the version with the bug. Bonus!
Example #6: Identifying User Cohorts That Are Worth Your Marketing Efforts
Not all of your users are made equal. Some of them will be power players who represent the bulk of your product usage (as well as the majority of your revenue) while others will be dormant with little hope for engaging and monetizing them.
Naturally, you would all love to identify the users that can earn you the most revenue and focus your marketing efforts on them. But how do you do that?
Well, you can take advantage of your product analytics data by identifying different cohorts of users and comparing their key usage and monetization metrics.
Cohort Analysis With Amplitude
Cohorts is groups of users that share a common characteristic. You can create cohorts based on:
- Platform (e.g. Mac and Windows users). I had a product for which Mac users had 30% higher LTV compared to Windows users.
- Geography (e.g. users from France and Greece). Depending on the product, it might monetize well in certain countries while underperforming in others.
- Signup date (e.g. users who signed up in November and January). Imagine that your Black Friday campaign was a massive success. You targeted the right people and your November cohort has a much higher LTV compared to other months.
- User behavior or usage of certain features (e.g. users who shuffle songs and those who don’t). When building a feature, you really want its users to have better engagement and LTV. Otherwise, the feature was not a success and it is worth getting rid of it.
Now let’s create a couple of cohorts in Amplitude and compare them.
Imagine that you want to understand if it is worth investing in marketing for Japan. We can create a cohort in Amplitude for Japanese users like this.
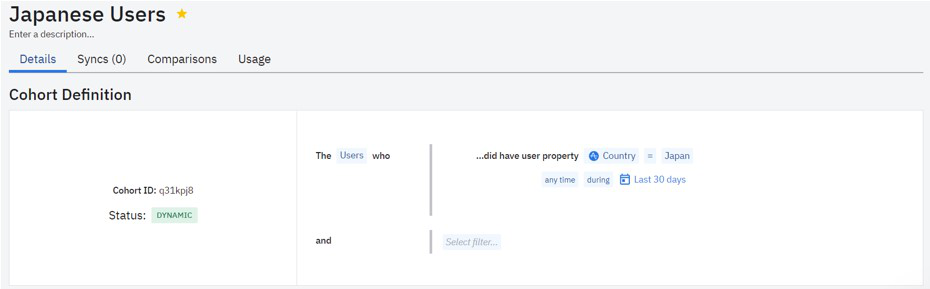
Then, we can compare the frequency of purchase actions of Japanese users when compared to everyone else.
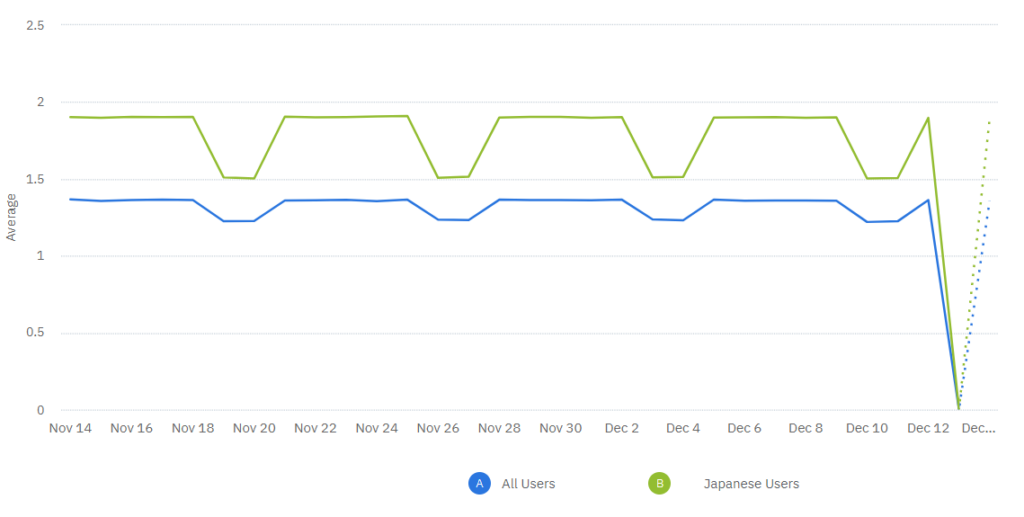
As we can see, Japanese users make more purchases than the average rate. Therefore, it is worth asking your marketing team to target Japan.
To Sum Up
Product analytics make your life easier as a product manager by letting you make data-driven decisions and not solely rely on your intuition and gut feelings.
Making informed decisions based on analytics data is great, but you should not stop there. Some of the other great tools that you can use to become a better product manager include:
- Customer feedback loops to make sure that everyone hears the voice of your customers.
- Wireframes to iterate on your design quickly and without hassles.
- PRDs to align everyone on the implementation details of the feature, and more.
Apart from reading these guides, you can also subscribe to our newsletter and let us deliver lots of product management goodies right into your inbox!
[ad_2]
Source link


![[Stuff You Probably Didn’t Know About] Video email signatures work!](https://wildfireconcepts-media.sfo3.digitaloceanspaces.com/2023/02/Untitled-design-440x264.png)


