
[ad_1]
How many email metrics do you and your email marketing team track to measure how your email program is performing?
The top five metrics marketers use to measure success — opens, clicks, unsubscribe, click to open and bounces — are all activity-based, the 2021 State of Email Analytics report from Litmus revealed.
Those metrics all have their uses, mainly as trend indicators. And the open rate, which was already an unreliable success metric, has become even more so since Apple launched its Mail Privacy Protection feature in 2021.
Several lesser-known metrics will shed more light on whether your email program is thriving, surviving or ready for resuscitation. Depending on your ESP and its built-in reporting, you can track these right in your dashboard.
The others will require some calculating and integration with other databases in your organization, or a third-party reporting tool can be very useful. But the extra effort will be worth your time and energy because you’ll understand better what’s going on.
1. Conversion rate
Depending on your ESP, this campaign-level metric might be reported in your dashboard. But even if you can view it there, take some time to calculate it on your own.
Why you should track it
When reviewing your metrics holistically, this metric will help you calculate your per-email-campaign success. You can use it to compare the success rates of email campaigns that target different-priced items.
How to calculate it
Take the number of conversions and divide it by the number of emails delivered (Note: Not the total number of emails sent).
Let’s say you sent 105 emails, and 100 were delivered. If 50 subscribers click on your website, and 25 of them convert, that works out to a 25% conversion rate.
What to know
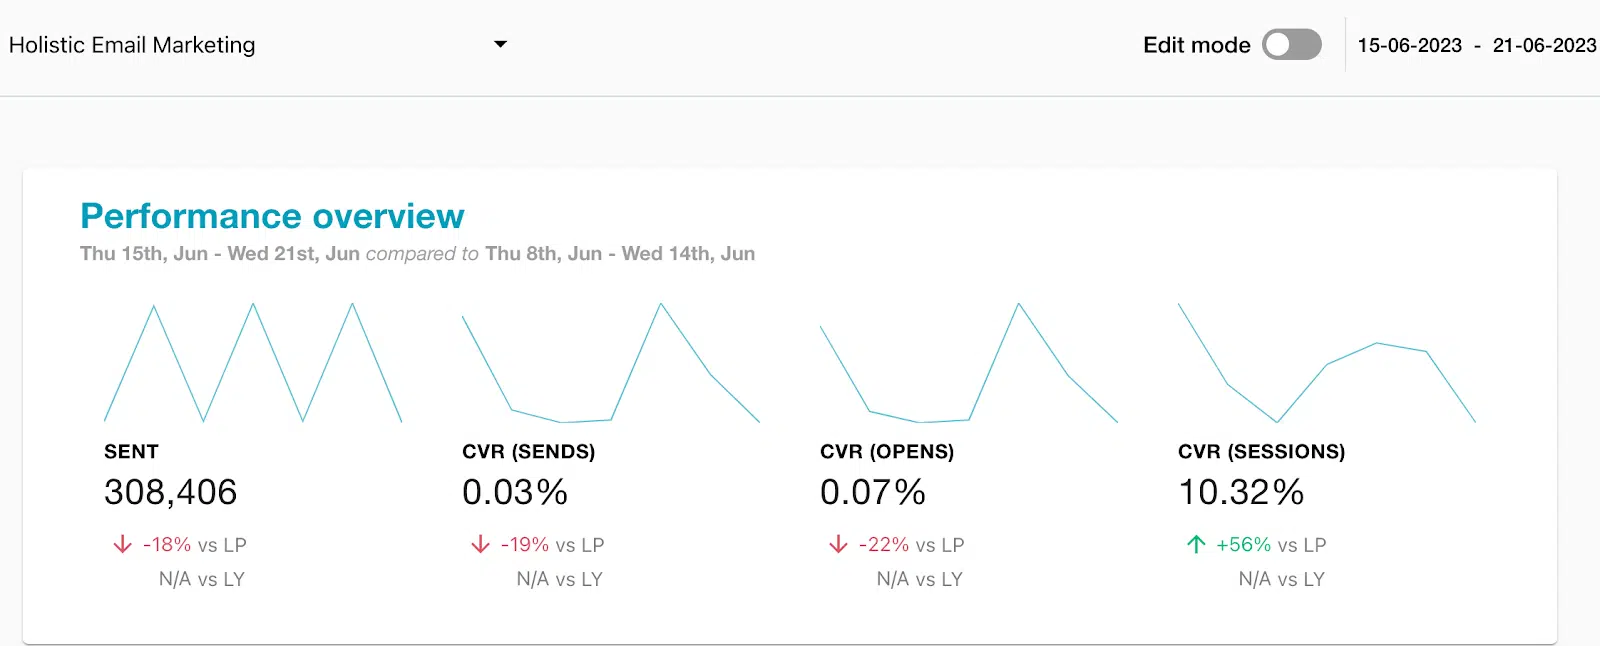
How you calculate conversion rate matters. Remember that Google Analytics uses landing page sessions to calculate conversions. Email marketers need to isolate email-related activity to find the actual conversion rate, which involves a larger number of metrics before customers get to the campaign’s landing page on your website.
If we were to calculate the conversion rate based on sessions, it would be 50%. That might look more impressive, but it doesn’t track back to your email. It’s the same number of conversions, just spread out over a much smaller field of possibilities.
Conversion is just one facet of the total email journey. If you focus only on website activity, you’re excluding engagement on other parts of the customer journey in which email plays a part. It could also lead you to optimize incorrectly or negate the impact of your email messages.
This reporting tool below showcases the different results for conversions, depending upon which calculation you use.
2. Value of an email address
This represents the monetary value of each email address in your database based on revenue from email. It is a business metric, not a campaign-level measurement.
Why you should track it
Unlike other metrics in this list, the value of an email address can help you make strategic and business decisions as well as campaign-level planning.
How to calculate it
Multiply the life of an address by annual email revenue and divide by the average list size in a year. For example, if the average life on your list is 3 years, your annual revenue from email is $700,000, and your annual list size is 95,000, the equation would look like this: 3 X $700,000 /95000 = $22
What to know
This metric illustrates why it’s so important to grow your email database. Here are two insights you can draw from this:
Reliable success metric
For example, suppose you want to increase frequency to increase revenue from email but are concerned that you could end up increasing unsubscribes or spam complaints from disgruntled subscribers.
While unsubs and spam complaints are one factor to consider, higher frequency can convert more subscribers to purchase, which in turn would increase revenue. Tracking email address value can reveal whether your subscribers respond with revenue or revolt.
Evaluate acquisition expenses
Knowing your email address value can guide your decisions on how much to spend on subscriber acquisition. The higher value, the more you can justify spending to attract higher-quality subscribers. If you don’t know your subscriber value, you could end up wasting your acquisition budget.
One note: This formula is more effective for B2C email marketing, especially retail and ecommerce. For B2B brands, the classic lead-nurturing process can make the value harder to determine.
3. Customer behavior beyond campaigns
This long-tail metric involves tracking campaign-level metrics beyond the immediate campaign time period. It helps you account for every bit of revenue from email and benefits your program in the long run.
Why you should track it
Because we usually have to move on so quickly to the next campaign, many marketers simply close out each campaign with a static report without going back a week or longer later. That’s a mistake because you likely will see some activity. If you keep tracking campaigns until you see no more activity, you could go months before you stop seeing conversions.
How to track it
Check your campaign activity regularly until you see no more activity. Automate this process through your reporting dashboard if you can, or send a manual reminder.
What to know
Most campaign reporting ends way too soon. But we know that customers often retain and act on emails days or weeks after you have moved on to a new campaign. That’s the long tail of email in action. Customers don’t always stop clicking after the campaign ends.
Email’s “nudge effect” explains this long-tail characteristic. Subscribers aren’t always in the market when your email campaigns arrive. If they’re engaged with your brand, they might keep your email in the inbox until they’re ready. Seeing your email can be enough to spur them to click and convert.
Up to 19% of consumers will save the email for later to take advantage of a discount, special offer or sale, DMA UK’s 2021 Consumer Email Tracking found. Although that number has been receding in recent years, it still points to a measurable source of revenue from email.
If you stop tracking activity too soon, you could be under-attributing revenue from email. One of my clients found it was under-recording email revenue by 128% when it expanded its reporting period from 4 days to 3 months.
Remember, the more revenue you can attribute to your email campaigns, the more budget you can request and justify to support your program.
4. ROI
Return on investment proves the channel’s value and financial success of your email program. It can help you gain more budget and resources. and helps you to gain more budget and resources.
Why you should track it
Email marketers historically are overworked and under-resourced. Part of it is our fault. We don’t provide detailed reporting, including many of the metrics I present here, and we don’t sing our own praises often enough. But ROI is one of email’s greatest advantages, so we need to measure it, report it and make sure financial decision-makers in our company know about it.
How to calculate it
Subtract campaign costs from total campaign revenue. Divide by costs and multiply by 100.
What to know
You probably are familiar with the general benchmark ROI numbers, which range from $28 for every $1 spent to $44 or more. While those numbers are nice to know, it’s more important that you know your own ROI.
This metric is one your C-suite executives are likely to understand. You can use it to build business cases for additional spending that can bring in more revenue, increase engagement or have a similar positive effect on your goals and objectives.
You do run the risk that your executives will be so happy with ROI as it is that they won’t see the value in increasing spending. That’s when you can use ROI to reveal missed opportunities that need budget funding to deliver.
5. Open-reach, click-reach and conversion-reach
These engagement metrics measure how well you engage your audience between campaigns.
Why you should track it
These metrics measure how many unique subscribers have opened, clicked or converted on your email campaigns at least once in a certain period. They are invaluable for measuring the overall engagement of your email program.
How to calculate it
Choose your activity (opens, clicks or conversions) and measure how many unique subscribers opened (for open-reach) or clicked (for click-reach) at least one email per month, quarter or year. For conversion-reach, you calculate how many unique subscribers converted in the chosen period.
What to know
By using this metric, you can identify the total reach of your campaigns for that quarter. For these engagement metrics to be truly useful, they must correlate to conversions and revenue, such that increasing open-reach also increases revenue.
Each of these metrics has value (even the open rate) when you use them to track trends — whether they’re increasing or decreasing. Adding reach to the equation gives you more information than you would get from each of these activity-based metrics by themselves.
A few minutes with a calculator — or, ideally, good data visualizations displayed right in your email marketing platform’s dashboard (a girl can wish!) — can pinpoint your strengths, highlight your weaknesses and help you map out new ways to message your customers more effectively.
6. Customer lifetime value (CLTV)
This business metric helps you focus on customer retention and customer experience (CX).
Why you should track it
This number is helpful as both a benchmark metric — is it trending up, down or stable, and how does it compare to lifetime values of other marketing channels? — and as an absolute number that represents the value a typical customer represents.
How to calculate it
Calculate your average customer’s yearly spend and multiply it by the average number of years your customers are active. You also can calculate it based on different life stages or segments, such as the average customer compared with loyal customers.
What to know
CLTV is a long-term business metric that represents value beyond a single campaign’s average order value or revenue per email. After all, customers don’t — or shouldn’t — buy just once from your brand.
While you can track it over time to learn whether customers are spending more or less with your brand, its greater value is as the foundation for building business cases showing email’s contribution to company revenue or to support a request for additional funding for acquisition, automations that can make your email messages more effective and drive more sales, and so on.
7. List growth
This metric measures whether and how your list has grown in a set period.
Why you should track it
Perhaps you look at your total list number when you get ready to send a promotional campaign. You can see it right there in your dashboard: “Sending campaign to 500,000 recipients.”
Or you look at how many people received your message. But how long has it been since you analyzed whether your list is growing or shrinking?
How to calculate it
Count both the number of opt-ins in a month, quarter or year and the number of addresses removed because of unsubscribes, spam complaints, bounces and inactivity.
For example, if you start Month A with a list of 100,000 addresses, and start Month B with a list of 110,000, you might assume your list grew 10%, or by 10,000 addresses. But if you removed 5,000 addresses for the reasons I listed previously, your list actually grew by 15,000 addresses or 15.8%.
What to know
In my experience, most people either don’t measure list growth or look at only the total list size occasionally. But you need to measure your exact growth so you can understand how well your acquisition efforts are working or whether you’re losing more subscribers than you take in. You’ll also understand better how much churn your list goes through in a year, which is important to know if you need to hit a list-growth goal.
Suppose, for example, you need to increase your list by 20% for the year. If you have a list of 100,000 addresses, you might think you need to add 20,000 new email addresses. But you’ll need more than that if you lose 5% of your list every month to churn. The chart below shows how churn affects list acquisition.
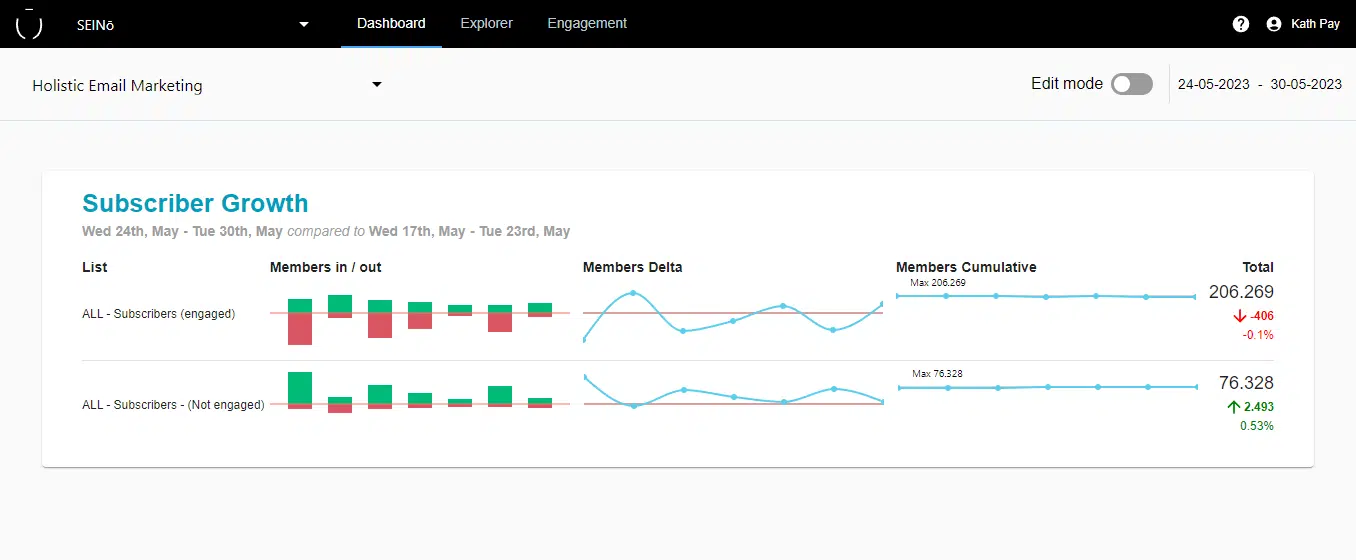
Knowing how list growth fluctuates month to month will help you better understand how changes in decisions like frequency (how often you send messages) and cadence (the intervals between messages) affect frequency. The bottom line can obscure the finer details of both churn and acquisition.
Go beyond your ESP’s dashboard
Although many ESPs now offer more detailed metrics, most still focus on email activity like opens, clicks and unsubscribes. A separate robust reporting tool that integrates across databases enables you to slice up your data in more relevant ways and understand what’s really happening with your program. You can use this information to identify where you need to improve or where advanced services can help you drive more revenue.
Reporting tools like these give you another advantage — immediate access to your data. You might work with a terrific analytics team, but you probably have to compete with other marketing channels or departments for their time and attention.
Customized reports can be a long time coming, and you probably don’t have the luxury of time to wait, especially with holiday marketing campaigns or annual goals and strategy to create.
Get MarTech! Daily. Free. In your inbox.
Opinions expressed in this article are those of the guest author and not necessarily MarTech. Staff authors are listed here.
[ad_2]
Source link


