Client reporting is often a sore spot for agencies. Collating social media stats from multiple channels, pulling out their KPIs, and turning them into a good-looking report can take hours. That’s hours a marketing agency doesn’t have. The process can be time-consuming, tedious, and unappreciated by clients.
Or at least, it used to be.
hbspt.forms.create({
region: “na1”,
portalId: “8477337”,
formId: “74e4624d-9793-4257-93d4-8e263a68afe0”
});
Let’s look at how easy it is to create reports for multiple clients using Agorapulse.
Creating Reports for Multiple Clients: Agency Pain Points
As director of Contentworks Agency, I can conclude that the traditional methods we used to create reports were dull, exhausting, often inaccurate.
Time-consuming
In a recent social media survey, 31% of marketers spend up to 10 hours on reports, compared to the four hours outlined as industry normal. That’s just for one set of reports.
As an agency with multiple clients, you could easily spend several days creating reports. That’s time you just don’t have and that you would prefer to spend talking to clients and planning campaigns.
So tedious
My pet peeve is logging in and out of different social media networks.
On average, each of our clients has three social media networks managed by us. Multiply this by 15+ clients—and you have 45 logins. Then, you need to grapple with individual platforms reporting, downloading CSV files, pulling out the data, and putting it all together in a PowerPoint you had to make.
Inaccurate data
One thing I realized when creating reports manually back in the day, is that there may be inaccuracies in the data.
That could be because:
You’re not comparing time frames correctly.
Your reporting starts on a different day each month, you’re not pulling the same figures each time or your manual calculations and comparisons about follower numbers and engagement are incorrect. And that’s understandable. Busy, stressed-out social media managers can easily make these mistakes.
Cut corners
Social media managers are not in the same mindset as social media data analysts and don’t usually enjoy creating these reports. That attitude can lead to corners being cut, guesstimates being done, and the clients not ending up with an accurate picture of their social media landscape.
Make sure you’re avoiding these common mistakes even experienced social media managers make.
Client Pain Points
Now we’ve got the agency pain points out of the way, how about the client ones?
Years of experience working with clients and previously with management and shareholders have given me some great insights. I understand what works and what doesn’t and more specifically, what annoys clients when it comes to reporting.
Complex jargon
This is one of the biggest grievances that clients have about social media reporting. Your agency has thrown a ton of charts, jargon like LTV, CTA and CTR into a report and delivered it.
Most of the time your clients or shareholders are not social media experts. They don’t need to be because they hired you!
Showing off by cramming in impressive buzzwords and pages of data is likely to irritate your clients. Alternatively, they simply won’t understand the data and may draw their own incorrect conclusions on your work. Our clients are busy people, and they don’t want to spend time unpicking your jargon.
Difficult to read
Along with complex jargon in the client annoyance stakes is a report that’s difficult to read. Perhaps it’s multiple different documents for each channel. It’s delivered via excel or large paragraphs of text that are time-consuming to read.
Clients generally don’t have time for this. They want to see:
Headline data
An indication of progress
Next actions
Inconsistent reporting
Clients don’t like receiving reports at different times of the month or for unequal timeframes.
For example, you start out sending reports at the end of January, end of February, then you send one on March 5 … then April 10.
Your clients like to see your reporting at the same time each month and may even plan team meetings or shareholder emails to include it.
It’s also easier to compare full months with each other—rather than four weeks here and three weeks there. I like to send our reports at the end of the month on the last working day.
Agency tip: Be sure to specify the days you will aim to send your reports each month, so your client can plan.
Find out how to prepare now for end-of-year client reporting
No conclusion
Client reports should always include a brief conclusion, recommendation, and action points.
For example: Based on your reports, we recommend you create more GIFs and videos for your Twitter as these see 3x the engagement of regular tweets.
Your action items don’t need to be essays. In fact, better that they’re not. Always include highlighted data and small snippets of education.
This is important for you because …
Not KPI-related
Marketing agencies are usually in the know about client KPIs.
Either they’ve told us at the start or, we’ve told them at the start in their initial strategy. So, if you then produce reports for clients that have no bearing or mention of their social media KPIs, you will certainly make them question what you’re doing.
You will also make it difficult for them to justify using an agency when they cannot follow the link between goals and actions.
Always link your client reporting back to each client’s unique KPIs. If you’re not achieving them, don’t be afraid to say so. It simply requires a change of direction.
So, you can see that actually, an agency’s pain points and a client’s are much the same. Neither wants to handle lengthy complex reports that take hours to produce and read.
Why do that then?
Let’s look at some best practices for client reporting and how Agorapulse can help agencies create reports for multiple clients.
How Often Should I Send a Report to Clients?
As I mentioned above, consistency is important in regards to sending reports. Doing so will also help you as an agency because you can dedicate the last working day of the month to creating and sending reports, as an example.
Here are some other timeframes to consider.
One-off reports
If you’ve run a campaign or spent the budget on advertising then you might want to create a smaller and more focused one-off report to analyze campaign performance.
Research reports
Sometimes, a client will show an interest in a particular keyword, region, or demographic. You can be an awesome agency and offer to provide your client with a research report to help them decide.
Regular reports
As we discussed, this should be your staple report. Monthly reports that show your progress on social and benchmark the clients’ KPIs. You can also include a competitive comparison month on month, too.
What Timeframe Should the Social Media Report Cover?
While we need to remain consistent with our monthly reports, different timeframes might be used sometimes.
Takeover reports
If your agency has just taken over the management of a client’s social media channels then produce an interim initial report. This could be a snapshot comparison between your first month running the account and their previous month.
Weekly reports
If you’re spending budget on a particular campaign, you might want to keep a sharper eye on it rather than leave it to run for a month.
Monthly reports
Regular monthly reports are the norm for us. (We aim to produce them on the last working day of each month.)
Quarterly/yearly reports
Many clients have quarterly or yearly meetings with shareholders and directors. Providing them with the exact snapshot to take into their meeting is usually very much appreciated.
Agency tip: Agencies working with multiple clients might want to stick to the same reporting timeframe. If you onboard a client mid-month, then produce a report to the end of the month and then get them into monthly report patterns like your other clients.
What Data Should You Include in a Social Media Report?
The data you include in your report should be meaningful to clients. So, in this case, one size does not fit all. A basic report from Agorapulse includes the following metrics:
Account growth
Audience demographics
Impressions
Content overview
Engagement
Community management
Best times to publish
These are metrics shown per channel and ideal for a small marketing team or an agency just starting out.
Here’s a report from Contentworks’ own Facebook account in the month running April 16 to May 15. This is using the basic reporting method, so each channel report would be created separately.

Overview of key performance metrics
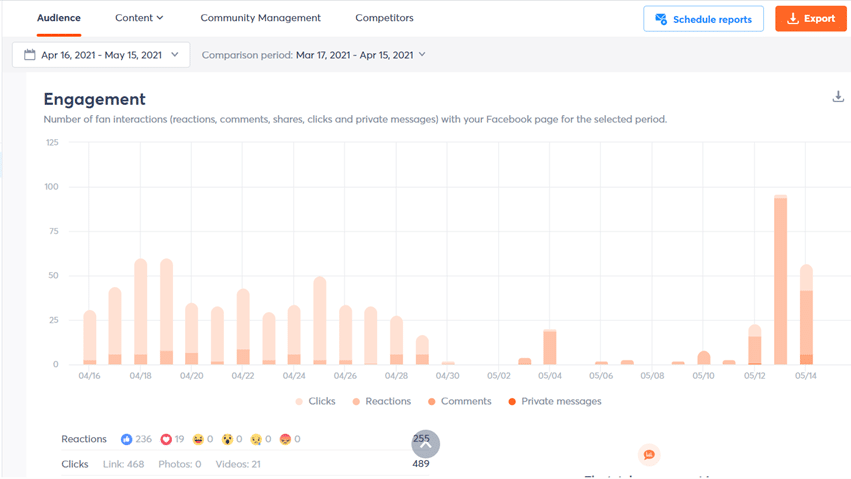
Audience engagement metrics for a social media report
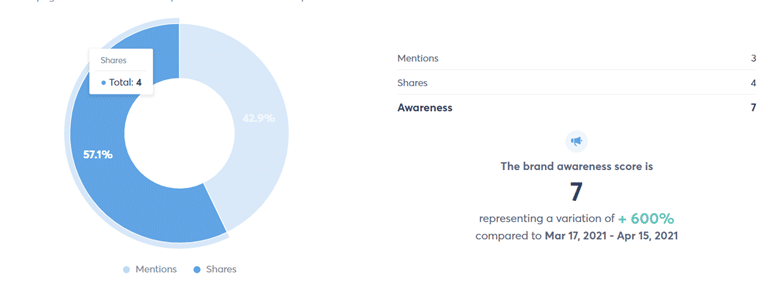
A Power Report Offers Many More Options
An Agorapulse Power Report has a ton more options that are accessed via the Create A Report tab on the top left side of your dashboard.
These are ideal for creating multiple reports on multiple channels.
For agencies, this is a winner because you can choose the exact report you need for your clients. Want to dig into a specific channel’s campaign? You can go for an individual report.
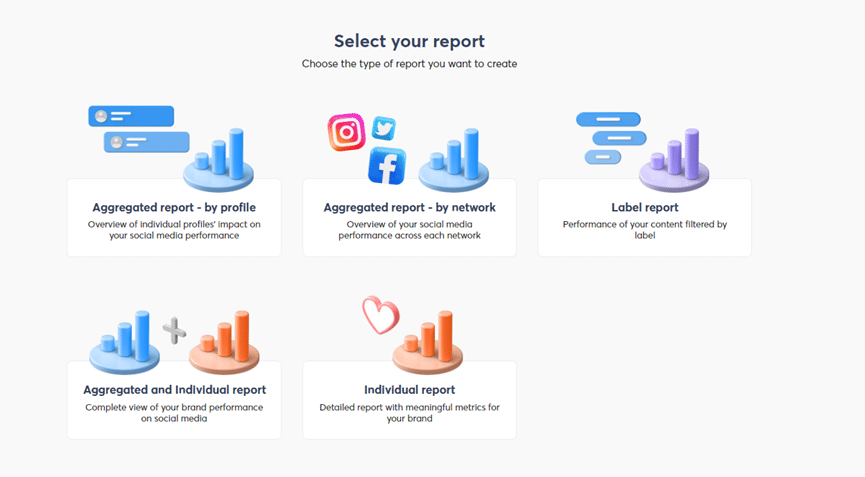
Example of Agorapulse’s Power Report types
Managing multiple channels for your clients? Access all of them at once using an aggregated reporting method.
Here’s a testimonial from Kelly of Baby Got Content about Power Reports:
Here I can see all my client accounts on the left side and select the ones I want to include up to 10.
A client is unlikely to have more than 10 social media networks with you (the average is 3) so that means everything fits in one report.

Social profiles to include in your social media report
Once you’ve chosen your channels, you can choose the metrics you want to see included.
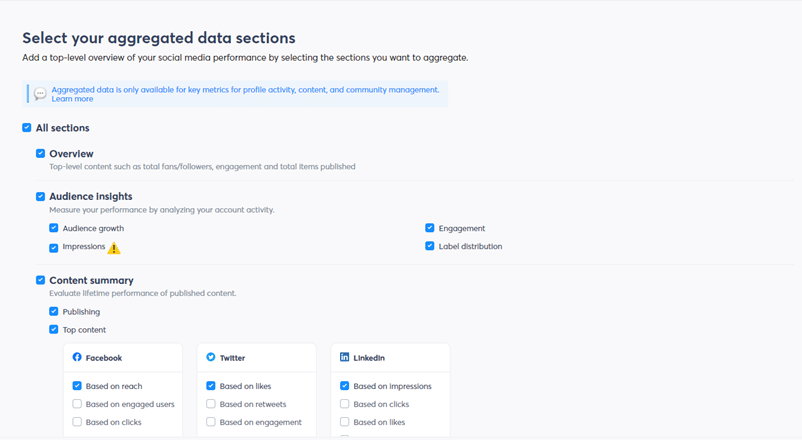
Select your aggregated data sections for your social media report for agency clients.

Community management can be included in your report.
Schedule the reports to go out each week or month without you having to log in and activate them. It’s a good idea for you to also send them to yourself so you have seen them along with your client.
Additionally, you can select the exact time, timezone, day, or date you want the reports to go out each month. This saves on calendar reminders or post-it notes on your desk!
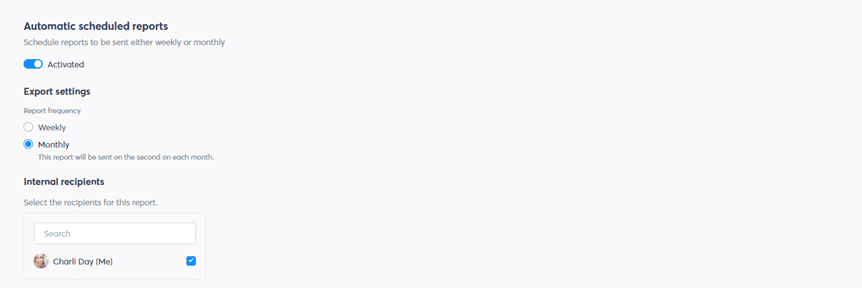
You can schedule reports with Agorapulse.
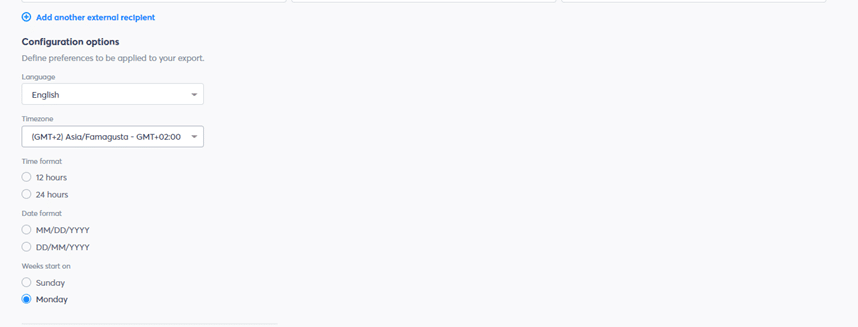
Customize the report for a professional agency feel by adding the logo of your agency or your clients.
Below you can see I added my Charli Says logo (client) and the Contentworks Agency logo (agency). This will then appear on the report giving it a professional feel.

You can customize your report with Agorapulse.

Export your social media report for agency clients as a PDF.
Aggregated Reports are great for agencies needing to send multiple reports. That’s because they combine data from the channels at the top:
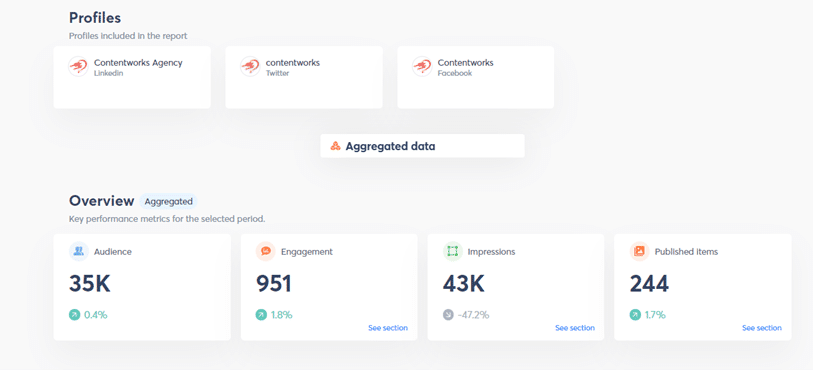
Select profiles for your client reporting.
But then they also itemize each channel below like this.
Clients love to see their Top Content. What performed best in the month for each channel. This highly visual report makes it easy for clients to scan and see what’s happening for their brand.
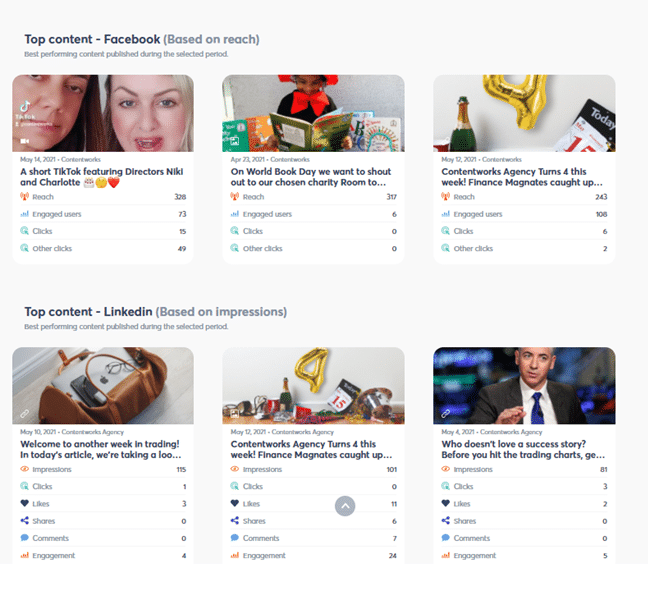
Include top content in your agency client reporting.
You can use the Label Reports features of Power Reports to track the success of marketing campaigns, generate tailored reports for any stakeholder and inform your marketing strategy with additional data. You can create as many labels as you need for up to five social profiles.
Create better content with data from your social media report
When you hit Export, your report is sent to your chosen email within five minutes.
If you have got your reports scheduled, they will go out automatically without you even needing to log in!
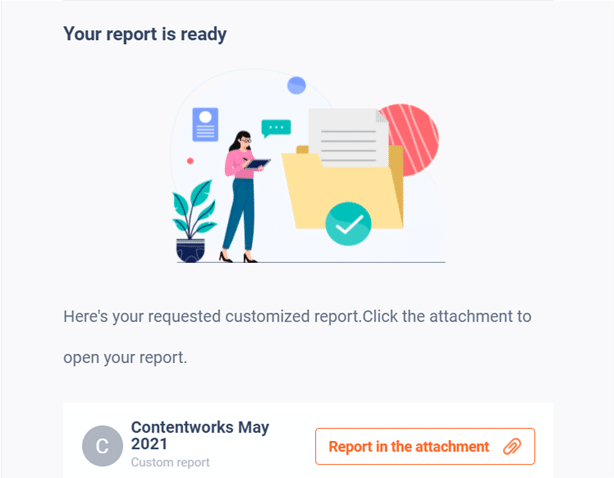
Example of a customized report for your agency clients
You or your clients will receive a PDF report containing their own customized report. This is easy to read, share and save, and contains all the channel data in one document.
Agencies producing reports for multiple clients can easily save them in the client’s server folders after receiving them automatically each week or month.
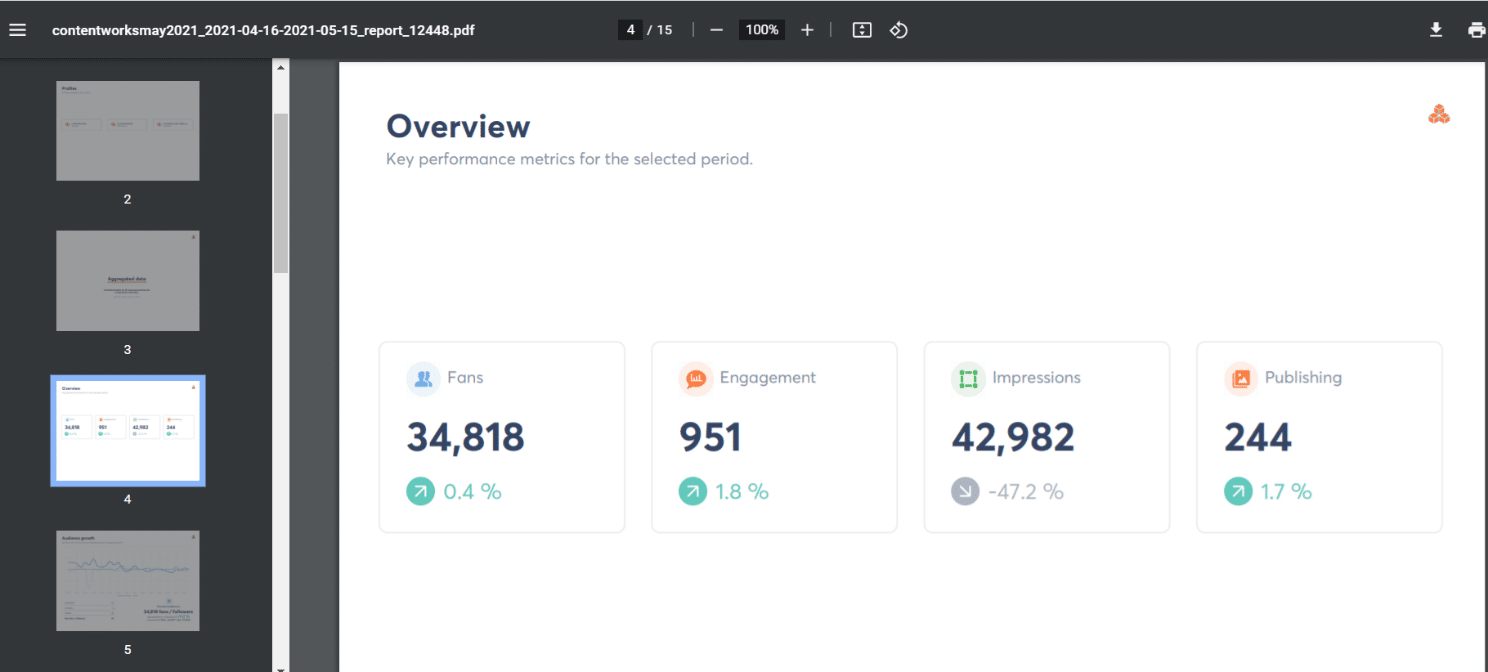
Overview of key performance metrics
You can benchmark key metrics like reach, engagement, and negative feedback against the average page’s performance via AgoraPulse Barometer.
You can also choose to add slides to your report for your conclusions or personally mail reports to clients with an email overview. This depends on your agency workload and whether you want to remove the scheduled element of reporting.
Agency tip: Arrange regular Zoom calls with your clients. It doesn’t need to be monthly, but a quarterly call to go through the reports is a winner. Have the reports in front of you or pull of a quarterly report to go through together. Doing so gives your client the chance to ask questions or discuss action items.
Agorapulse for Agencies
Agorapulse is an agency favorite because they understand our pain points and address them head-on. They also know the time constraints, client demands, and resourcing struggles faced by most.
The Agorapulse dashboard combines everything an agency needs to successfully manage multiple clients in one place. That’s scheduling, responses, assigning team members, and creating killer reports.
A Power Report takes several minutes to create and export compared to hours logging into platforms and exporting data separately.
Goodbye confused, rushed, and messy PowerPoint or excel reports, and hello calm, easy, and slick Power Reports.
Take control of your social media! Check out our free trial of Agorapulse to help you schedule, track, and measure all your social media efforts.
Read more: agorapulse.com


