There’s no question that 2020 was the year of video and we’ve got video benchmarks to prove it. Some organizations were well on their way to embracing a digital-first approach to business before the pandemic, while others were forced to do so out of necessity.
The move to digital-first work has translated to a digital-first approach in the way we connect with prospects, customers, and each other. Whether it’s through live Zoom calls, virtual event experiences, or asynchronous video messaging—the use of video exploded in 2020.
With where we see the trends taking us, that trajectory isn’t expected to slow down. We’ve made the transition, and with that, our customers’ and employees’ expectations and preferences have changed forever. From now on, we’ll be using video to connect, educate, and create trusted relationships when it matters more than ever.
Here are the key shifts we’ve seen supported by our benchmark findings for 2021:
Using video for sales has gone from “explore” to “invest”Everyone is becoming a creator—no longer are we dependent on massive production budgets and teamsThe proliferation of user-generated ‘record-and-share’ videos across the entire business is the new norm
As the use of video increases, it’s important to have benchmarks to guide best practices, identify opportunities, and evaluate success. That’s why we created the fourth annual Video in Business Benchmark Report, which analyzes business’ use of video to support sales, marketing, and communication efforts.
 Video in Business Benchmark Report
 Know where you stand, so you can stand out. Get the insights you need to craft a video strategy that works.Get the Report
So let’s dive in on this year’s benchmarks so you can see how you stack up, and in turn, stand out.
Contents1.Video Benchmarks for Creation and Publishing1.1The Number of User-Generated vs. Produced Videos1.1.1Total User-Generated vs. Produced Videos1.2User-Generated Video Trends by Month1.2.1User-Generated Videos Created Per Month1.3Video Creation Trends by Industry1.3.1Average Number of All Videos Per Company by Industry1.4User-Generated Video Creation Trends by Industry1.4.1Average Number of User-Generated Videos Created Per Company By Industry1.5Produced Video Trends by Industry1.5.1Average Number of Produced Videos Per Company by Industry1.6Video Creation Trends by Company Size1.6.1Average Number of User-Generated vs. Produced Videos Per Company by Company Size1.7Trends in Resources Used for Video Production1.7.1Resources Used for Business Video Production2.Video Benchmarks for Content2.1Trends for Different Types of Business Videos2.1.1Types of Videos Businesses Have Already Invested In2.2Video Distribution Trends2.2.1Distribution Channels Where Video Content is Used2.3Top Video Distribution Channels Based on Role2.4Video Benchmarks for Length2.4.1Video Length Distribution3.Trends in Video Engagement and Retention3.1Video Benchmarks for Engagement Rates3.1.1Average Engagement for Different Lengths of Video4.Video Analytics Trends4.0.2Companies Making Use of Different Levels of Video Analytics5.How to Use Video Benchmarks to Your AdvantageVideo Benchmarks for Creation and Publishing
Given the proliferation of video in 2020 with the shift to remote work, it’s no surprise that when we look at the overall number of videos created last year, we saw a 135% increase over our 2019 findings.
New to this year’s analysis, we’re looking at a breakdown between videos that have been recorded using the Vidyard screen recorder tool (referred to as “user-generated or user-recorded video”) along with those videos that are uploaded to the Vidyard platform (referred to as “produced videos”). We went this route to give a more granular view of types of videos being created and to demonstrate the growing shift of video creation beyond the marketing use case, i.e., user-generated video created for sales conversations.
The Number of User-Generated vs. Produced Videos
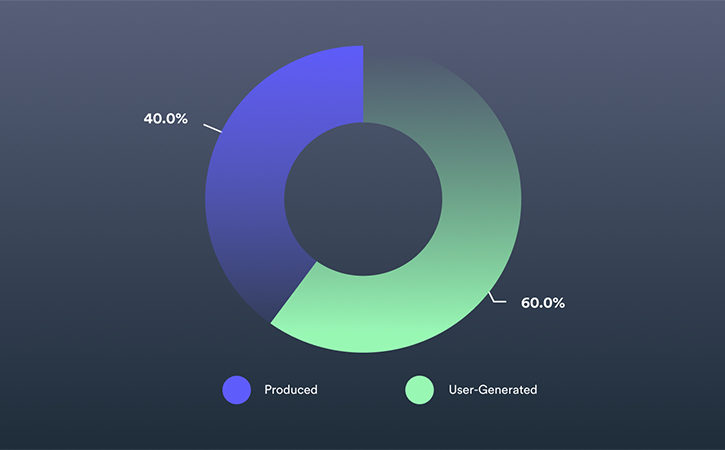
As more individuals across organizations become creators, it’s no surprise that 60% of overall videos in 2020 were user-generated or user-recorded versus the 40% that were uploaded or produced in more traditional ways.
Total User-Generated vs. Produced Videos
User-Generated Video Trends by Month
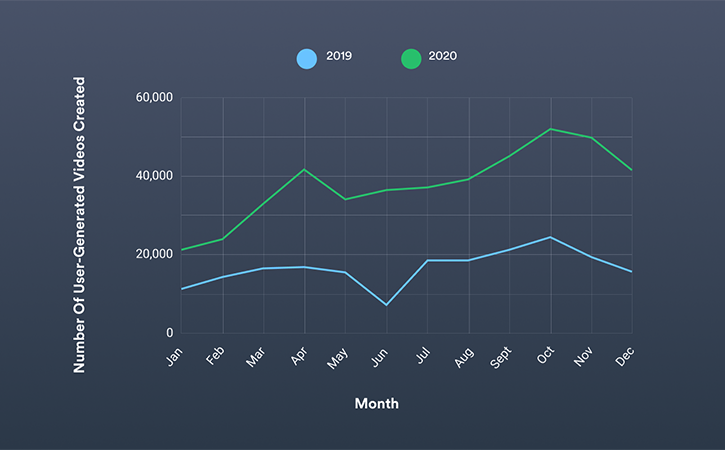
Overall, when we look at user-generated video growth, we saw a 128% increase in 2020 over 2019. When the COVID-19 pandemic hit in early 2020, video became essential as a communication tool as businesses went remote and needed efficient ways to connect with prospects, customers, and employees.
When looking at the total number of user-generated videos created in 2020, we saw a 44% increase from the first quarter of the year to the second, with a noticeable spike in April. This jump was likely a direct result of most organizations going remote and realizing the need for asynchronous video as a means of communication—specifically for sales reps. They were no longer able to meet customers on-site and needed an alternate means to communicate to keep business moving forward.
We saw a continued and steady rise throughout the rest of the year, with another jump in the Fall when many countries and regions went back into lockdown. Slight dips in December aren’t surprising when considering seasonality.
User-Generated Videos Created Per Month
Video Creation Trends by Industry
Each year, we see a more diverse spread of industries embracing video, along with the use of an online video platform to manage both recorded and produced video content. Video is used across various industries for several different purposes, including marketing, sales, communications, and support.
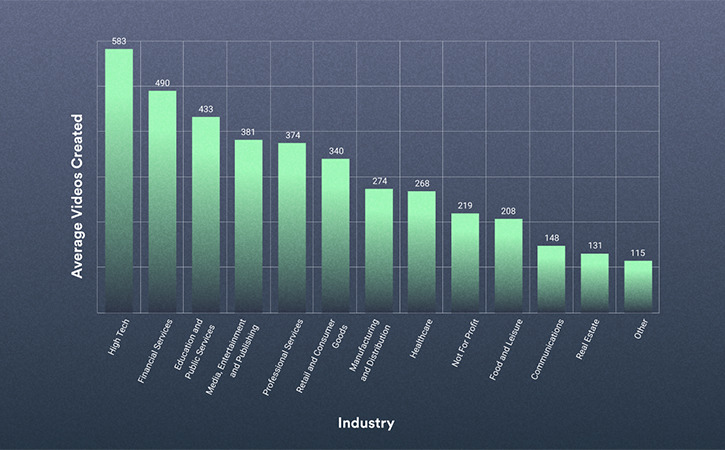
Overall, the high tech, financial services, and education and public services industries created more videos on average in 2020 than in other fields.
High tech has always been a leading industry for video creation. Still, this year, two new contenders, financial services and education and public services, have seen exponential growth—up 129% and 203% respectively over 2019.
Average Number of All Videos Per Company by Industry
User-Generated Video Creation Trends by Industry
When we break down the total number of videos created by industry, we’re able to ascertain some additional insights about which industries are recording video versus which are producing or uploading video content.
The use of one-to-one video for sales conversations increased by 93% in 2020. This means it’s no surprise that the volume of user-generated video created by companies in these industries aligns with the fact that many made the move to digital-first work environments. There’s a growing necessity for sales teams to go virtual and for organizations to leverage asynchronous video as a means for internal communications.
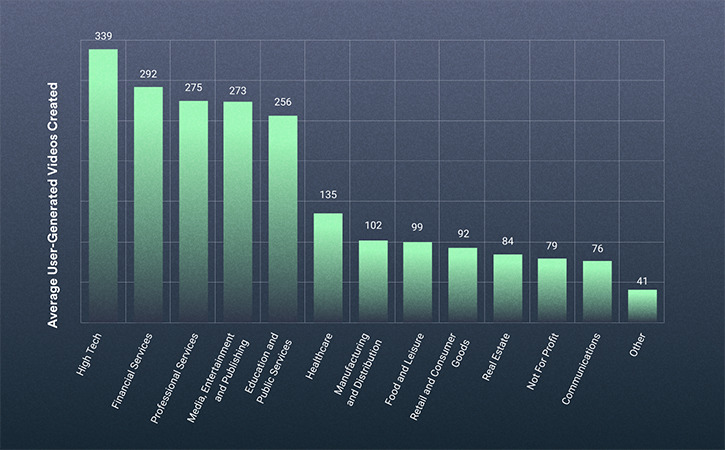
High tech still leads the charge, with an average of 339 user-generated videos per company in 2020. Running very close behind is financial, professional services, and media, which makes sense given that many companies in these industries made the move to digital-first work in 2020.
Average Number of User-Generated Videos Created Per Company By Industry
Produced Video Trends by Industry
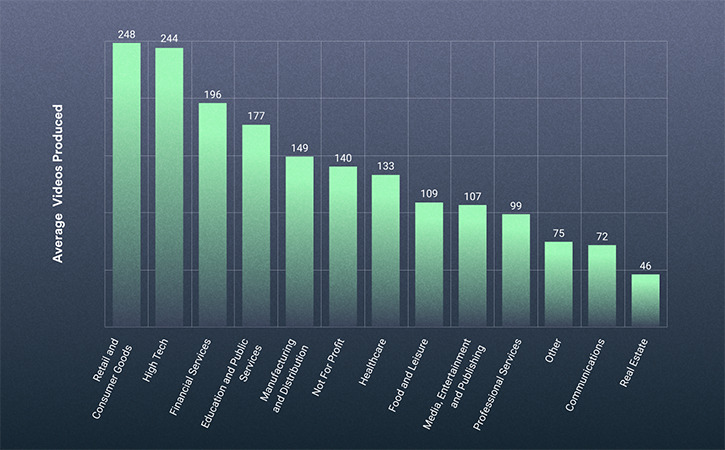
When we look at uploaded or produced video content on its own, we see a bit of a surprising difference: retail and consumer goods just barely out-published high tech. This is logical given the shift to frictionless online buying experiences in the B2C space, where more consumers are looking to do research and purchase online. Product, FAQs, and promo videos all align as a way to dynamically educate buying audiences online.
Average Number of Produced Videos Per Company by Industry
Video Creation Trends by Company Size
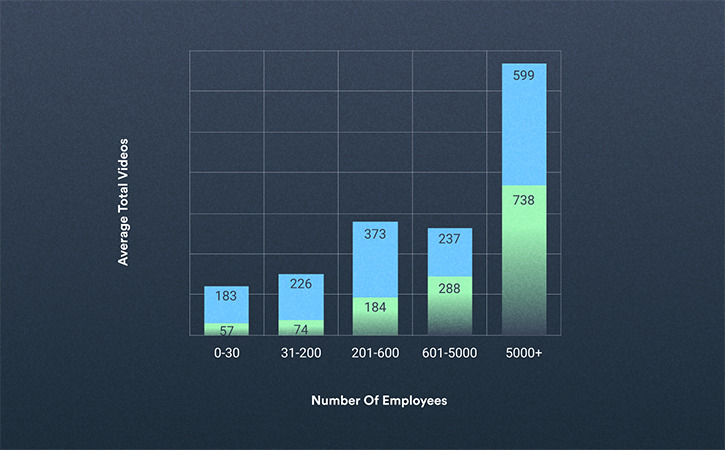
Unsurprisingly, companies with a larger number of employees tend to create more videos. The largest enterprises (those who have more than 5,000 employees) created on average more than 1,300 videos throughout the year, which is up 149% over our 2019 findings.
Overall video creation increased significantly across the board in 2020 (up 135% over 2019). But when we look at the distribution of those organizations in the 0-200 and 200-5,000 range, we don’t see as many differences in production rates as in years past. The more even distribution among these company sizes makes sense in the context of our other benchmarks, which have found that more users (outside of just videographers and producers) are creating video content.
When we look at differences in user-generated vs. produced video by company size, larger enterprises still create the most user-generated content. However, when we break down what percentage of video content is user-generated vs. produced, we see smaller organizations are creating user-generated content at a much higher rate.
Approximately 75% of video content created by companies under 200 employees is user-generated, while only 45% of the video content created by organizations with more than 600 employees user-generated.
Considering the cost and lift required to record a user-generated video is negligible, the entry barrier is much lower if not free. And as such, organizations of any size can take advantage of this format, and many smaller organizations are doing just that.
Average Number of User-Generated vs. Produced Videos Per Company by Company Size
Trends in Resources Used for Video Production
The vast majority of brands are maintaining or increasing their video content production budgets. But when it comes to how videos are produced, do companies work in-house or look to outsource?
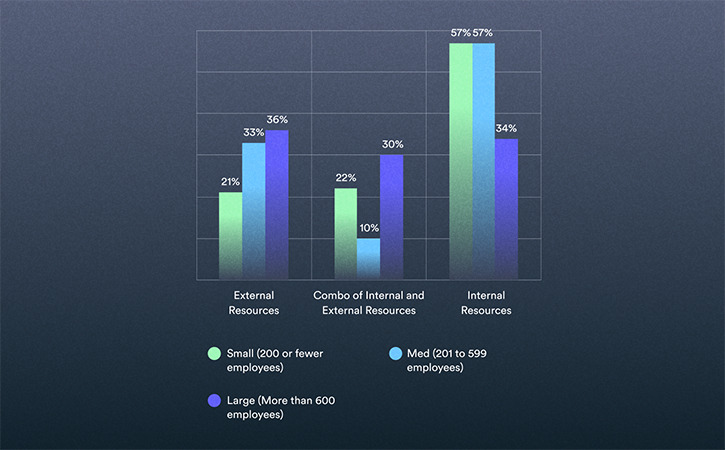
Not surprisingly, as company size increases, so does the use of external resources for video content creation. Most small and medium companies use exclusively internal resources to produce their video content, while large enterprises are more evenly split between internal, external, or a combination of both.
For smaller organizations, investments in internal resources have grown by up to 19% over our 2019 findings, with a decreased focus on external resources or a combination of them. Mid-sized companies appear to be investing more in either exclusively internal resources (57%) or exclusively external resources (33%), with a de-emphasis on a combination of resources (down 64% over 2019 findings).
The increase in companies either going in-house or external suggests that more businesses are investing in hiring employees to create video content or otherwise aligned with the trends we’re seeing in user-generated content growth.
Resources Used for Business Video Production
Video Benchmarks for Content
Now that we’ve had a chance to dig into the trends and benchmarks around video creation, let’s go a little further and look at video content including the most popular types of business video, distribution trends, and data around video length.
Trends for Different Types of Business Videos
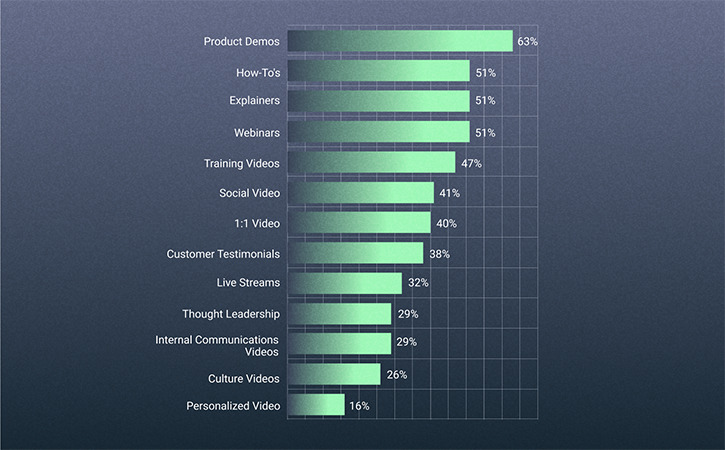
The most common types of business-created videos are product demos, followed by how-to’s, explainers, and webinars. The popularity of how-to videos in particular has seen a 50% increase over 2019 results.
The increased use of these educational type videos aligns with the larger shift toward self-serve buying experiences. For many B2B buyers, they’ve already made a purchasing decision before they ever talk to sales—so the more self-serve educational content that buyers can discover, the more informed they’ll be.
One of the most notable callouts is the exponential growth we’ve seen in the use of one-to-one video. This is most common for salespeople as a means to communicate with prospects and customers, but it’s also becoming a critical internal communications tool as well. The percentage of companies who are investing in one-to-one video grew from 7% in 2019 to 40% in 2020, representing a 471% increase year-over-year.
Types of Videos Businesses Have Already Invested In
Video Distribution Trends
When it comes to digital, video is an incredibly powerful content format that can be used across a variety of channels. We hear year after year how well video converts compared to other content mediums—in 2020, 94% reported that video converted the same or better than any other content form.
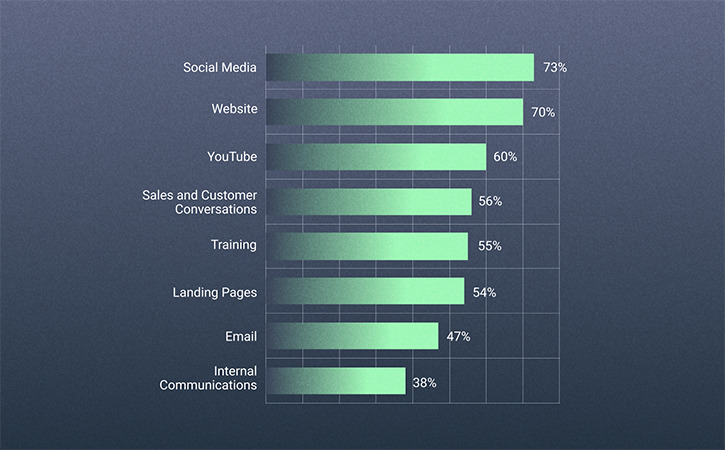
The most popular B2B distribution channels for the year are social media, websites, and YouTube.
While the number of businesses using video across these channels year over year remains steady, one channel that has grown exponentially is using video for sales and customer conversations, which increased by 93% over 2019 findings.
Internal communications as a channel to distribute video content also saw a 27% increase over our previous year’s study. It’s not surprising given how many organizations have moved digital-first. They now need to rely more heavily on video for internal communication to remain connected and disperse information across the remote organization.
Distribution Channels Where Video Content is Used
Top Video Distribution Channels Based on Role
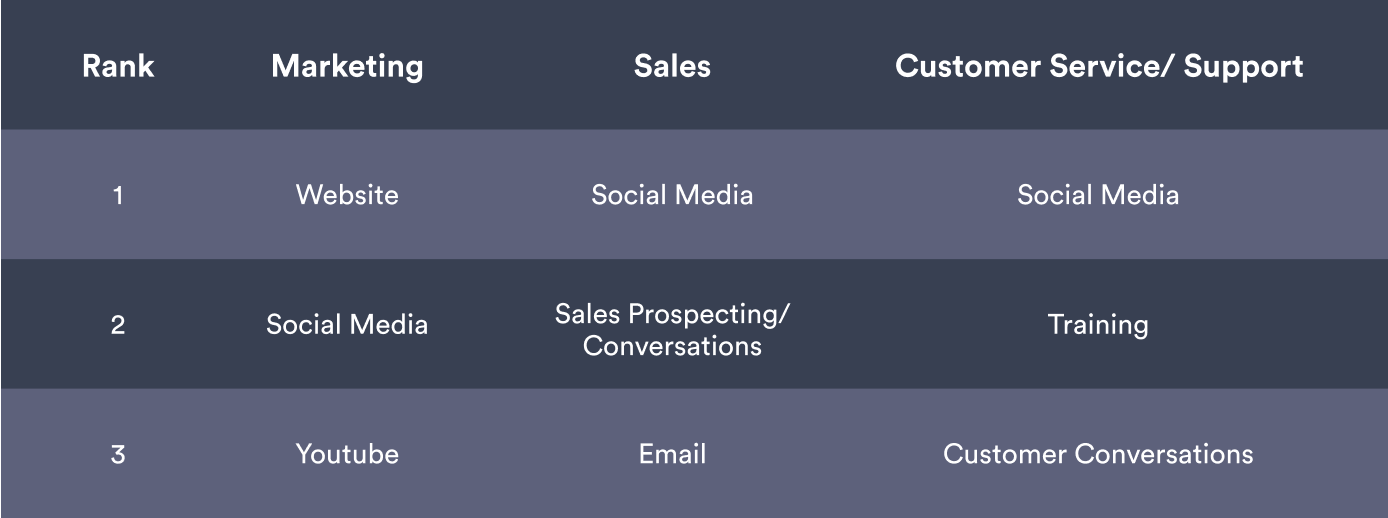
As expected, the locations where video is distributed can differ based on its role within an organization. When looking at the top three video distribution channels by role, the common thread between marketing, sales, and customer service are social media. With over half the world now on social media, it makes sense that all roles within an organization share social media as the top distribution channel.
Video Benchmarks for Length
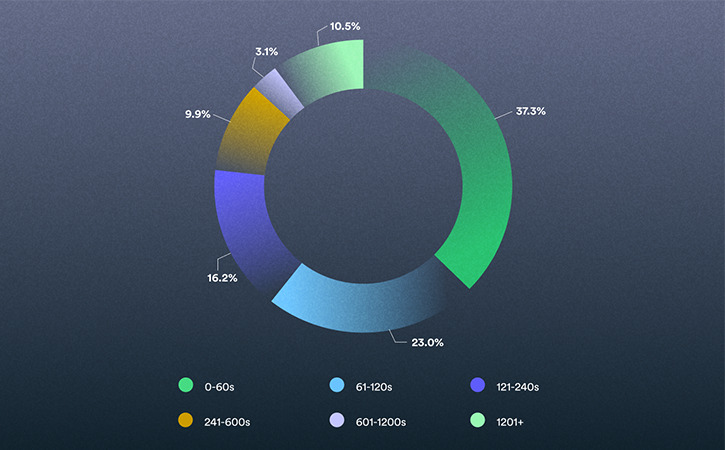
The average length across all videos in 2020 was 6.06 minutes—which is up from the 4-minute average of our previous year’s study. This increase represents the first year since the launch of this report in 2016 that the average video length increased compared to the previous year.
The majority of all videos (60%) are less than two minutes in length, which makes sense given the proliferation of user-generated video for sales conversations.
Video content falling in the two-to-10-minute range is actually up compared to our last study. Again, it’s leaning on the trend of frictionless, self-serve buying experiences to provide educational content to prospective customers upfront. These videos can be longer than traditional sales, explainer, or social media video content.
The number of videos falling into the 10-to-20-minute range remained in-line with our 2019 findings. However, we saw a 66% increase in the number of videos over 20 minutes in length. With the cancellation of many in-person events throughout 2020 and the meteoric rise of the virtual event, this shift aligns with the notion that more companies are creating longer-form educational video content like seminars, workshops, and webinars.
Video Length Distribution
Trends in Video Engagement and Retention
Not every viewer who clicks play makes it to the end of the video. And while some drop-off is totally normal (be honest, you don’t finish every video you watch either), a video’s average retention rate can tell you a lot about how well it’s resonating with your target audience.
If the majority of your viewers only make it halfway through your video but the most important message is three-quarters of the way in, then they’re missing the point entirely. This kind of insight into viewer behavior gives you the opportunity to evaluate your content and make sure your most important message is loaded up front.
According to our annual customer survey, adding CTAs to video content is one of the top feature priorities for both sales and marketers. So having an understanding of viewer drop-off also gives you intel on when you should add in-video CTAs to try and push your viewer to the next step before losing them.
Video Benchmarks for Engagement Rates
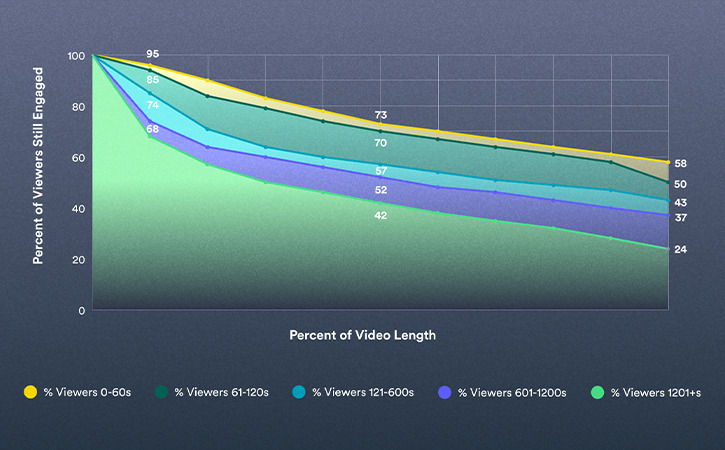
But when it comes to drop-off, how much is normal? Regardless of length, an average of 45% of viewers made it all the way to the end of a video in 2020—less than the 52% who did the same in 2019.
However, the amount of time people spend engaging with a video also depends a lot on the type of video and how long it is. Just over half (58%) of viewers watch a business-related video all the way through if it’s less than 60 seconds, but only 24% will finish a video if it’s longer than 20 minutes.
If you’re producing longer-form content over 20 minutes (like on-demand webinars) consider how some simple post-production edits could make a big difference to your engagement. Cutting housekeeping at the top of the session and Q&A from the bottom are two simple ways. You can go further by trimming to cover just the main talking points or takeaways. Getting that session under 20 minutes could net you over 40% more audience retention.
Shorter videos (like those in the one-to-two-minute range) are usually more top-of-funnel and don’t tend to contain as much information. Ideally, sales prospecting videos or quick promos should stay under 90 seconds to keep your audience’s attention. And look to build out educational-based content to hit those longer-form middle buckets as well.
Average Engagement for Different Lengths of Video
Video Analytics Trends
The top challenge identified by businesses of all sizes is measuring video impact. As such, video analytics is becoming increasingly important to help businesses track the effectiveness of their video content. Analytics helps provide the context needed to know what’s working and what isn’t, what changes can be made to improve metrics like engagement or conversions, and what return on investment (ROI) the organization is getting from video.
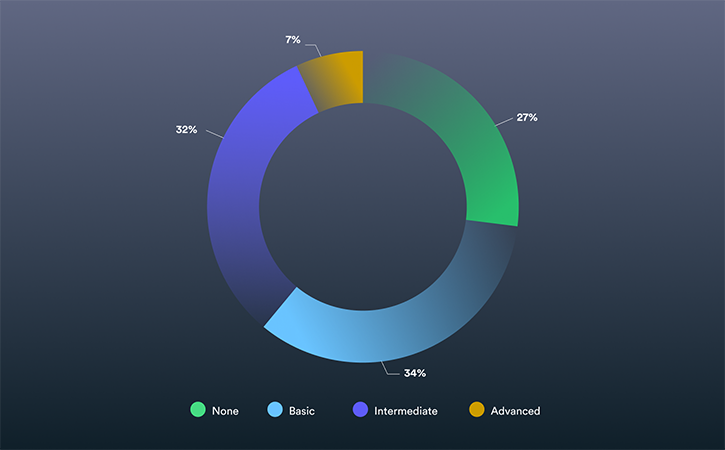
In 2020, 73% of companies reported that they’re using some form of video analytics. But the 27% that aren’t should rethink that strategy.
65% of marketers and nearly 90% of sales professionals report the importance of accessing video viewing data to qualify leads, engage prospects, or influence deals. Those that use intermediate or advanced analytics typically offered by enterprise video platforms are much more likely to report the return they’re getting from video is improving.
Companies Making Use of Different Levels of Video Analytics
How to Use Video Benchmarks to Your Advantage
As you’ve seen throughout these findings, video creation and distribution are rising, and we don’t see things slowing down anytime soon. Our customers and employees now have expectations that involve a digital-first world, with the ability to have video meetings and conferences, less travel, and quicker, more personalized responses.
From now on, we’ll be using video to connect, educate, and create trusted relationships when it matters more than ever.
Please take advantage of the critical shifts we’ve seen supported by our benchmark findings for 2021 by embracing the trends and trying them out for yourself. Download the full report to study these benchmarks further or share with your team.
 Video in Business Benchmark Report
 Know where you stand, so you can stand out. Get the insights you need to craft a video strategy that works.Get the Report
The post The Complete List of Video Benchmarks for 2021 appeared first on Vidyard.
Read more: vidyard.com


