[ad_1]
According to statistics, 79% of B2B marketers believe LinkedIn is a good source for generating leads, and 97% of B2B marketers use it to drive their content marketing strategy.
Needless to say, LinkedIn has come a long way from being just a job recruitment network to a goldmine of sales, leads, and branding for big and small companies, especially B2Bs.
But to run a successful B2B marketing campaign on LinkedIn, you need a data-driven approach derived from LinkedIn analytics instead of guesswork.

In this blog, we will see why it is important to use LinkedIn analytics for you as a B2B marketer and how you can use each section of analytics to bolster your LinkedIn marketing strategy.
Let’s dive in!
LinkedIn statistics can make or break your brand
No one can deny the need for LinkedIn in the life of a B2B marketer. Whether you want to build your team, client, sales, or brand awareness, LinkedIn is your go-to social platform.
However, the platform requires you to have a unique marketing approach when compared to other social media platforms.
And to really find the distinction between what you can do differently on this platform is by diving into your LinkedIn analytics.
On the other hand, avoiding your LinkedIn analytics could result in:
- Wrong audience targeting
- Fewer CTR on your posts
- Shrinking reach and impressions
- Less engagement
- No-competitor analysis
- Missing out on the best time to post on LinkedIn
- Less organic visitors
And the list could go on…
Hence, calling shots on LinkedIn without evaluating your analytics is not a wise thing to do.
Assessing your LinkedIn metrics will not only help you steer clear of all the listed setbacks mentioned above but also prepares you to adapt to the ever-changing audience behavior.
How to use LinkedIn analytics?
First thing first, to access your LinkedIn analytics, head to your company profile page, and click the “Analytics” written on the top bar.
LinkedIn analytics has divided all its metrics into three different categories:
- Visitors
- Updates
- Followers
We will look separately into each aspect of LinkedIn analytics to figure out what lies in each section that can be of significance to you and how you can use it.
1. LinkedIn visitor analytics
Visitor metrics give you deep insights into the people who have visited your company page and the action they took on it in a chosen time frame.
The Visitors section is further divided into 3 categories:
Visitor metrics: In here, you can recognize the visitor traffic coming to your company page in two ways.
First, you can see the total number of times your company page has been visited within a chosen time frame. You can also gauge the traffic coming on a specific page by filtering between all pages.

But these page views don’t give you a holistic idea of the number of people visiting your page.
So the second way is to assess your visitor metrics based on unique visitors coming to your company page within a chosen time frame. The unique visitor metric excludes multiple visits from a single user while showing unique visitor graphs.

Visitor demographics: This section tells you about the demographics of your page visitors. The visitor demographics data is divided into 5 categories: job function, seniority, location, industry, and company size.

Custom button clicks: Every LinkedIn company page can add a custom button on their home page, prompting visitors to take action. The visitor analytics shows you the total number of clicks received on your custom button in the past 30 days.
You can see this metric under the visitor highlight section.

You can add the following custom call-to-action button on your page: Contact us, Learn more, Register, Sign up, and Visit the website.
How to use LinkedIn visitor analytics?
Unique visitor metrics are a great way to determine the number of people interested in your brand. Remember that these people can be your potential customers.
But you can’t be sure until you bring visitor demographics into the picture. It segregates your visitors based on different demographics, using which you can create a more detailed buyer persona and fabricate a content strategy relevant to it.
You can also use visitor demographics to target the right audience with your LinkedIn ads.
But what if you are a new page looking to increase your page visitors or an old one with gradually decreasing visitor metrics?
It will help if you boost up the SEO of your LinkedIn company page.
Yes, you read it right. You can optimize your LinkedIn profile to gain more exposure by infusing relevant keywords in your company details. It helps you rank better in organic searches on Google and in LinkedIn company search features.
Another way to increase your unique visitors is to post consistently on LinkedIn. According to LinkedIn, companies that post 20 times per month reach at least 60% of their unique audience.
I’d recommend using LinkedIn tools to schedule multiple LinkedIn updates way ahead of time. It will give you the leeway to do tasks that you love and need more of your attention instead of posting each update manually.
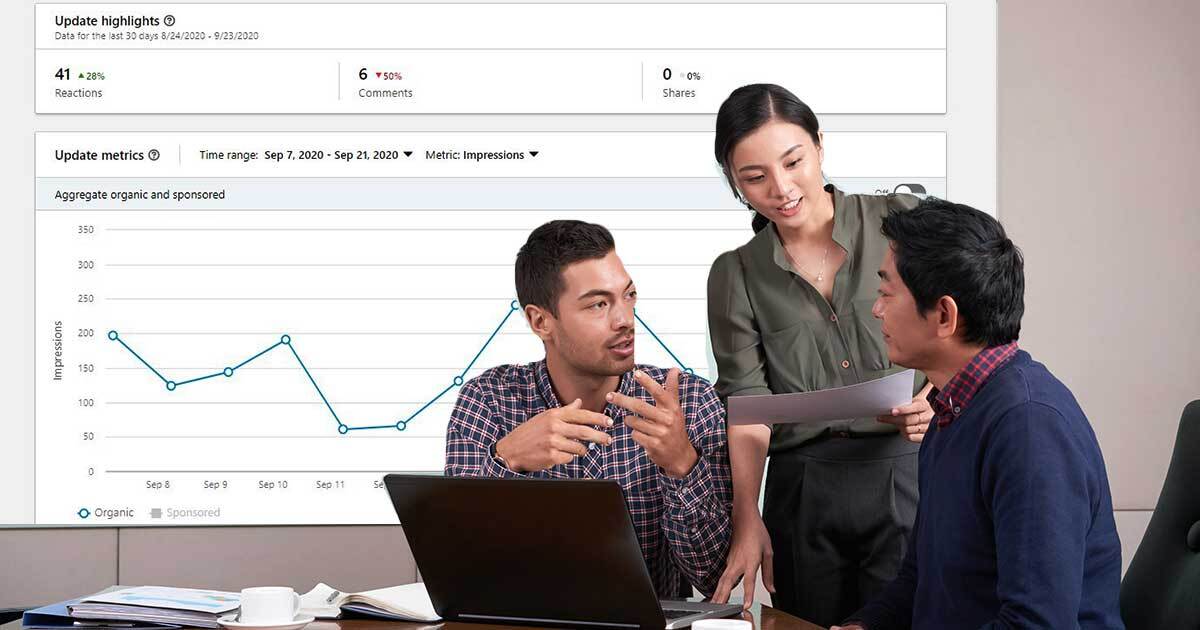
2. LinkedIn updates analytics
Once you deploy your content on LinkedIn, the next step is to check out how it is performing.
Update analytics help you figure out which of your updates are working well in garnering better impressions, reach, and engagement and which aren’t.
You will find the following metrics in your Update analytics section:
Impressions: The impression metric counts the number of times LinkedIn members saw your updates. It means if your company updates are seen by the same person twice, then it is counted as two separate impressions.
But to see the number of unique LinkedIn members that your post has reached, look for the “Unique impression” metric. It shows you the number of people who have seen your LinkedIn updates.
This distinction between impression and unique impression on LinkedIn is the same as impression and reach on other social media platforms.

Clicks: When a LinkedIn user clicks on your posts, company name, content, or logo, it gets counted as a click.
Further, you can see the click-through rate on each of your updates.
Wait, what is the click-through rate?
Click-through rate is the number of clicks versus the total impression you got on your updates.

Interaction : Interaction includes the number of shares, likes, and comments you got on your LinkedIn updates. They all sum up to create the engagement metric for you.

Engagement rate: LinkedIn calculates engagement rates by dividing all the interactions by the impression your updates have received.
How to use LinkedIn update analytics?
Update analytics is the testimonial of your content’s performance.
Looking at your updates, you can figure out which form of content is getting more traction and which one is struggling. It will help you hone your content strategy on LinkedIn.
Engagement rate and interaction are the key metrics to track if you are looking to establish your company as a thought leader among your followers and create engaging content.
A good engagement rate on LinkedIn is around 2%. However, you will see it reaching 5 to 6% depending on the quality of your content.
Moreover, if your content is falling short of getting good engagement, you can try some statistically-driven advice.
For example, image updates, on average, result in a 98% higher comment rate than posts without images. So use images to jazz up your company updates and announcements.

At the same time, don’t forget to add links in your updates since including the links can drive twice the engagement of a post without the link.
Tracking your update’s analytics will also tell you which update is engaging enough to be running as an ad in your prospects’ feeds.
According to Hubspot, LinkedIn has the highest visitor-to-lead conversion rate at 2.74%, almost 277% higher than Facebook and Twitter.

With this much potential in the platform, you would surely not want to misfire your lead generation’s chances by sponsoring an underperformed update.
3. LinkedIn followers analytics
What good is your LinkedIn marketing strategy if it knocks on the wrong doors looking for engagement, conversion, and sales?
News flash- it boils down to nothing.
It’s very crucial to know your audience before rolling out your content on LinkedIn, or anywhere for that matter.
LinkedIn followers analytics allows you to know your follower’s data based on different demographics.
In the follower metrics section, you can track how many followers you have lost and gained in the chosen time-frame. The graphical distribution of follower trends also shows how much followers you have acquired through ads and sponsored content.

Further, you can see your followers segregated into different categories, such as job function, seniority, location, industry, and company size.

Also, LinkedIn has recently introduced a new metric called “Companies to track.” This metric compares your follower trends, number of updates, and engagement rate with other similar companies’ metrics on LinkedIn.

How to use LinkedIn follower analytics?
You can use follower LinkedIn analytics to create relevant content by looking at your audience demographics. Knowing their seniority, job function, and the industry will help you create content that resonates with them.
At the same time, it will tell you if the followers in your roster are your ideal audience or not. If you are not attracting your relevant audience, then something is wrong with your brand messaging.
If you see your follower trends taking a nosedive week after week, gear up to create some ads to reach more audiences relevant to your business. Remember to sponsor your best posts after checking update analytics.
Competitor analysis helps you explore the strengths and weaknesses of your competitor’s LinkedIn profile.
Peek at your competitor’s profile to see what kind of content are they making? Blogs promotion? Video case studies? Infographics?
These insights will help you get an edge over your competitors.
SocialPilot: An efficient way to track your LinkedIn analytics
As a B2B marketer running campaigns on multiple social media channels to create brand position and awareness can be tiresome
To analyze efficiently, you need a more centralized place to look at your Linkedin analytics as well as for analytics of other social media networks.
That’s where you need customized social media analytics tools, such as SocialPilot.
SocialPilot, a Linkedin management tool, gives you a more centralized and straightforward interface to navigate through multiple social media platforms’ analytics.

You will get all the important engagement metrics for all of your LinkedIn content like text, images, videos, polls, articles carousels, etc. You can filter these posts to find out the best-performing ones.
Why choose SocialPilot to monitor your LinkedIn analytics?
- You can track analytics of multiple LinkedIn accounts in one click to make strategic decisions.
- You can access the engagement metrics regarding all best-performing posts, including various types of LinkedIn content, in Post/Update analytics.
- Download a shareable PDF report of your LinkedIn analytics to prove your social campaign’s worth.
- Get a holistic view of all the necessary LinkedIn metrics that you would need to create a better marketing plan.
Start your free 14-day trial now!
How to export LinkedIn analytics for your social media report?
Surely, you want to justify your findings and showcase your LinkedIn efforts to your boss, clients, or team members.
So, if you are someone looking for a ready-to-go comprehensive LinkedIn report, which is also visually appealing to better showcase your LinkedIn performance, then use SocialPilot analytics.
Its analytics feature not only shows you cross-channel metrics visually – graphs, word clouds, and charts- but also lets you download it in PDF format and email it to your clients in one click.

Sharing reports is not a one-time affair; your client will want LinkedIn analytics reports regularly. However, generating and sharing reports manually every other day can consume much of your time.
With SocialPilot, you can avoid this repetitive task by scheduling your reports. In a few clicks, you can easily export your performance data in a visually striking pdf report and schedule it to get shared automatically through email on a specific weekday or the first of every month.

On the other hand, you can use LinkedIn’s native analytics page to export your page analytics report.
Click the “Export” button in the top right corner of each LinkedIn analytics section to download your analytics as a .XLS file.

Conclusion
So now, you know how important it is to track your LinkedIn analytics. Remember that LinkedIn is an ever-changing ball game, and so are its analytics.
I’d recommend you to make a period-over-period comparison to see how much you have progressed in the current reporting time frame compared to the previous one.
Use the tips mentioned in this blog to make the most out of your LinkedIn analytics.
Speaking of most!
Don’t forget to use SocialPilot’s 14-day free trial to analyze your cross-platform analytics under one dashboard.
[ad_2]
Source link


