
Marketers love stats. We thrive on data. While we all consider ourselves to be creative, we need to use both the left and right sides of our brain to create winning campaigns that use stellar, original ideas fueled by data-driven concepts.
And there’s no better data than iron-clad social media statistics.
There’s plenty of data out there right now that has hundreds, if not thousands, of facts about social media—but it’s not all actionable or reliable.
So in this post, we didn’t want to just throw random facts at you for you to try to make sense of. Instead, we’re honing in on the 12 most essential core statistics (and a few stats that back each one up) to show agencies the actionable data that actually matters right now.
hbspt.forms.create({
region: “na1”,
portalId: “8477337”,
formId: “74e4624d-9793-4257-93d4-8e263a68afe0”
});
1. Users Spend an Average of 2.5 Hours Daily on Social Media … But Not All At Once
It can be almost mind-boggling to think about. But between a combination of different platforms, users are spending two and a half hours daily across all their preferred social media platforms as of 2021.
That can include engaging with brands, scrolling mindlessly, and watching videos on YouTube.
Millennials and Gen Z users are both highly engaged. Millennials are logged on an average of 2 hours and 38 minutes daily. Gen Z goes even longer for 2 hours and 55 minutes.
Understanding how their time is broken down is important, too, so consider the following:
Users spend an average of 4.9 minutes on TikTok each session, with an average of 8 sessions per day.
Users spend an average of 4.7 minutes per session on Facebook.
They spend 3.1 minutes on Instagram per session.
Snapchat users spend an average of 1.6 minutes per session.
How to use these social media statistics for your agency
Users are dividing up their time across multiple social media platforms. They may only be spending fleeting amounts of time on each app per session.
You need to do the following to take advantage of that fact and get their attention while they’re on each app:
Publish content at peak posting times. You want to be towards the top of their feeds. Timeliness plays a factor in all social media algorithms. (Get the details about the best times to post.)
Use Stories. We’re going to discuss this more in just a few sections, but Stories are a popularly used feature and can help you get visibility fast.
Schedule your content in advance. Want to take advantage of peak posting times and dealing with the hassle of publishing content across multiple platforms? Use Agorapulse’s publishing tool to hammer out your schedule ahead of time. Never missing an opportunity to reach your audience.
2. 54% of Social Browsers Use Social Media for Product Research
This varies slightly by platform, but overall, social media users want to discover new products, research products and brands, and help with their buying decisions.
This is particularly prominent on Pinterest and Instagram.
83% of Instagram users are on the platform to discover new products. A total of 87% of participants in a survey said they took an action like making a purchase on the platform after seeing relevant information.
For Pinterest, over 89% of Pinners use the platform for purchase inspiration or product research. Some 98% have tried new things they discovered on Pinterest.
How to use these social media statistics for your agency
If you’re not using Shopping features that are available on each platform, you’re almost certainly missing out.
Make sure you’re doing the following:
Create diverse content calendars that include sales-focused posts. Though your entire social presence should never be all about pushing sales, you should be trying to sell sometimes.
Share mission statements, “how it’s made” content, and updates about what’s new with your company. Users aren’t just shopping for a specific product. Many want to love the brand itself, too.
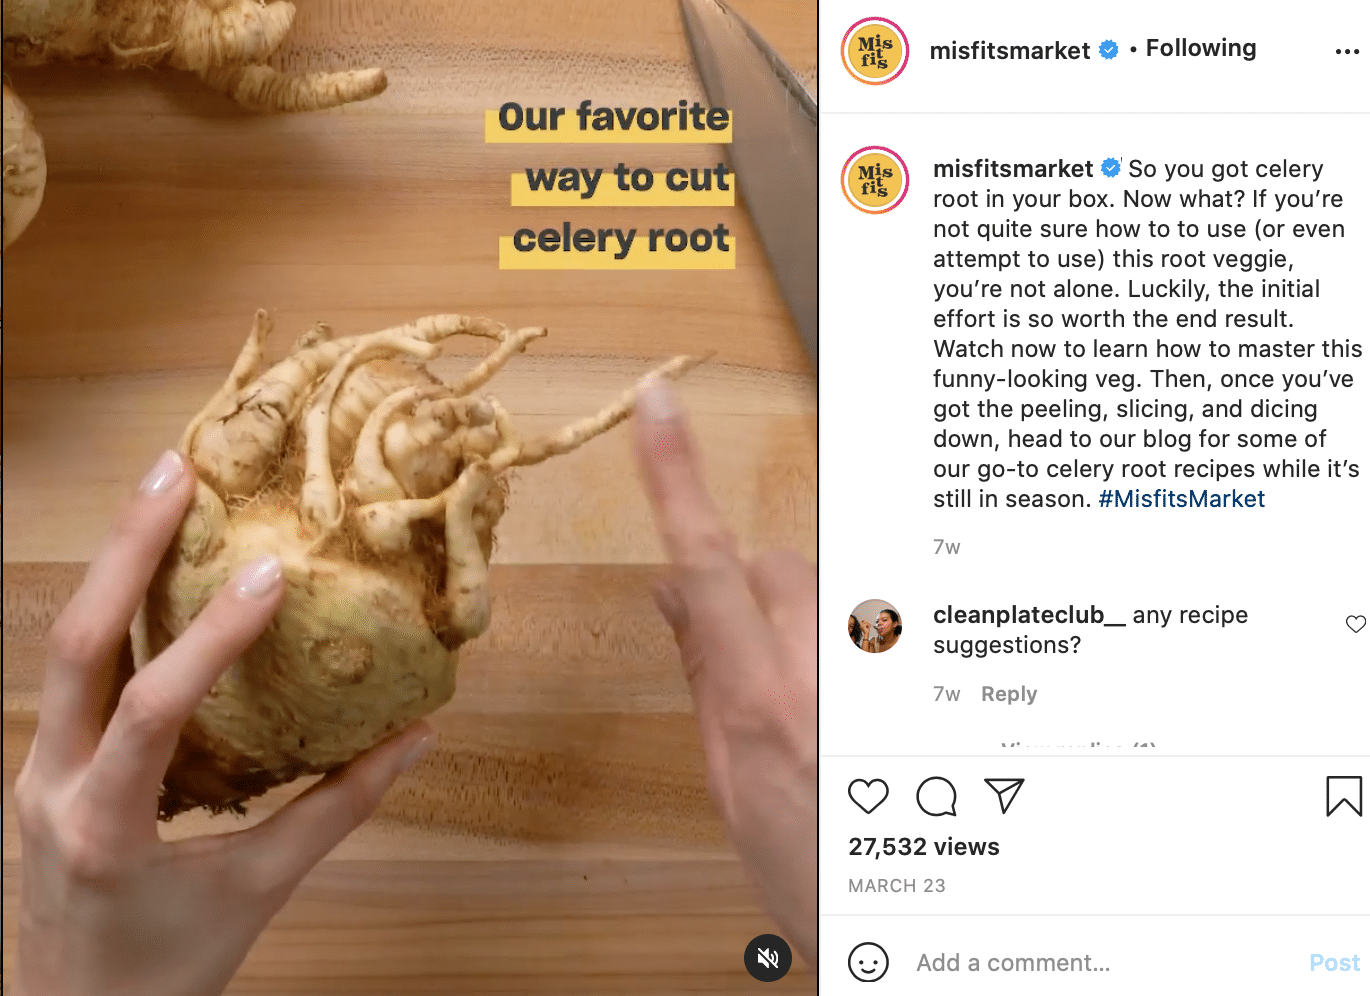
Create video content that educates users about products. Show users how to actually use the product to highlight its value and drive more sales.
Use shopping features. I know, I already mentioned it, but I’m saying it again. Each platform has native shopping features available to drive purchases in-app. Use them.
3. Facebook Stories & Instagram Stories Have Over 500 Million Daily Viewers Each
Facebook and Instagram Stories each have 500 million daily viewers respectively on their own platforms. That’s about the number of average daily users Instagram currently has. So, we know that most users are checking their Stories feed at least once daily.
How to use these social media statistics for your agency
Simply put, create more Stories.
Use the feature on both Facebook and Instagram because you should always take advantage of the chance to reach more users.
Since current recommendations are for brands to post between one and seven times daily (which is a lot of content), we strongly recommend doing the following:
Use Agorapulse to create and schedule Stories in advance. Sit down all at once to map out a week or month’s worth of content. Schedule it so that it can be published at the right times. It can be overwhelming otherwise to try to think of so much content daily.
Tell linked Stories each day. You can share multiple snippets of reviews from users back-to-back, or break down a minute-long video into four different Stories. This can increase view and engagement rates, and it makes it easier to come up with enough ideas to keep you going.
Share UGC. Sharing user-generated content (UGC) is one of the best Stories best practices. It gives you instant content with just a few clicks, and users love to see it.
4. 54% of All Social Media Users Want More Video Content
Social media marketing blogs have been harping about the value of on-platform, native videos for several years now. That won’t change anytime soon.
Users say they want more video, and there’s plenty of data that shows that their actions back this up:
Videos on Instagram receive 21.2% more interactions than images and 18.6% more interactions than multi-image posts.
81% of businesses prefer video marketing on Facebook.
Videos drive the most clicks out of all media options on Facebook Ads.
Video views on Twitter had a 62% increase year-over-year from 2019 to 2020, and a 72% increase in video watch time.
How to use these social media statistics for your agency
This is another relatively self-explanatory action following this social media statistic: Use more videos!
Here are a few tips that can help, especially if you need to create large amounts of video at scale:
Don’t be afraid of mobile-shot video. Mobile-shot video looks authentic. It can increase engagement and CTR rates on both organic and ad content.
Use video creation tools. Video creation tools like Animoto can be a game-changer for busy businesses trying to create more video.
Go live. Aside from some quick prep time to get ready for the live, this is a great way to incorporate more video into a brand’s strategy that will drive engagement without having to spend hours editing at a computer. Plus, users love it.
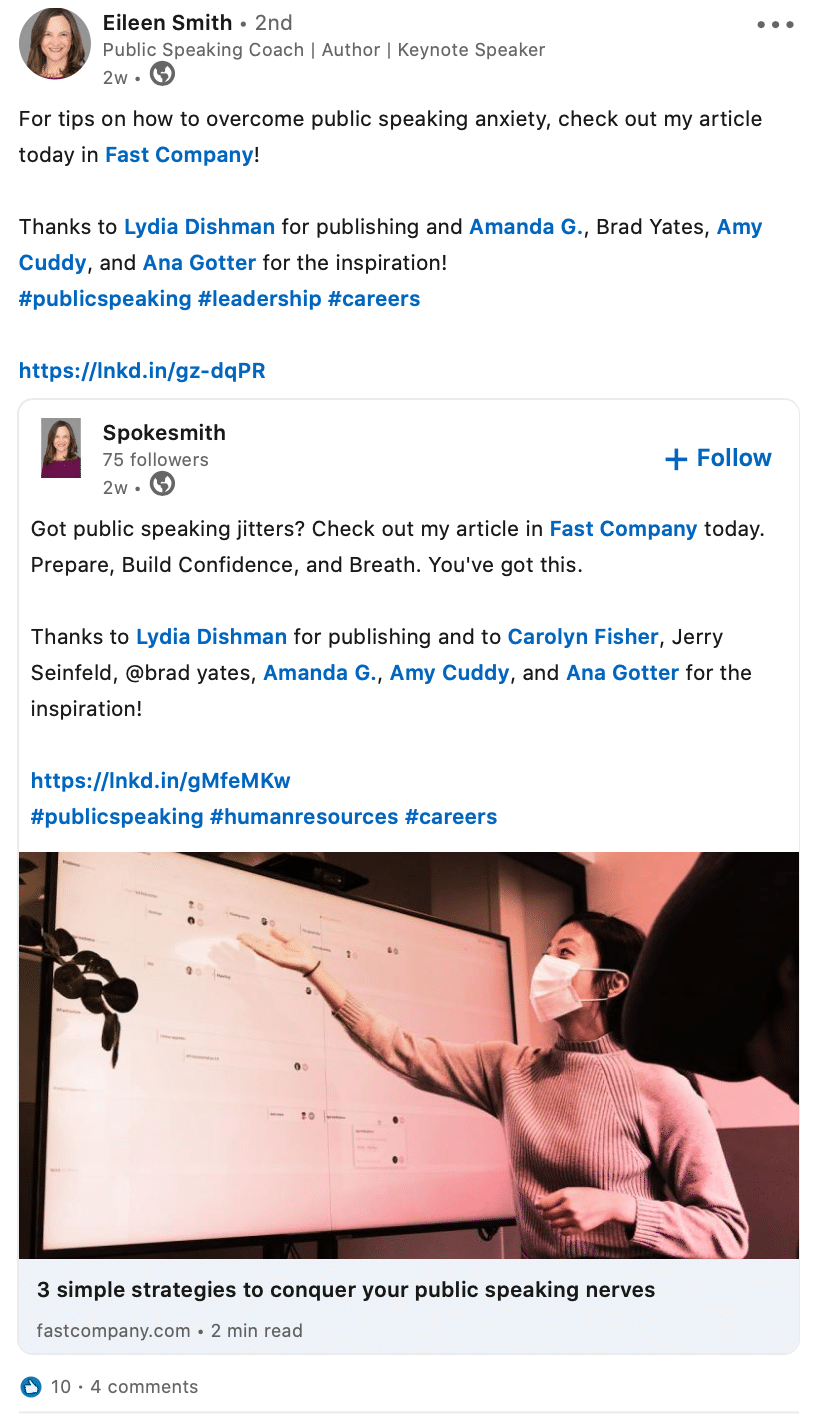
5. LinkedIn Is the Top Paid & Organic Social Platform For B2B Businesses
LinkedIn is a big deal for B2B brands. It’s their place to shine.
For agencies, this is THE best platform to promote your own brand and the brands of any B2B clients you have.
Consider the following:
LinkedIn was voted the most trusted social media network in 2020.
46% of all social media traffic to company sites comes from LinkedIn.
96% of B2B marketers use LinkedIn for organic content, and 83% use it for paid social.
82% of B2B marketers report finding the best success on this platform.
How to use these social media statistics for your agency
Use LinkedIn to promote your agency. That should be a primary focus.
You’ll want to do the following:
Have your own team (if they’re willing) share and promote content that can bring people back to your agency Page. Post from your company page, too.
Share long-form content designed to share value and spark conversation. You can treat LinkedIn, in many ways, like a content platform. This can expand your reach and drive results.
Test both paid and organic content on the platform. Agencies could absolutely do exceptionally well with paid ads. Test it out.
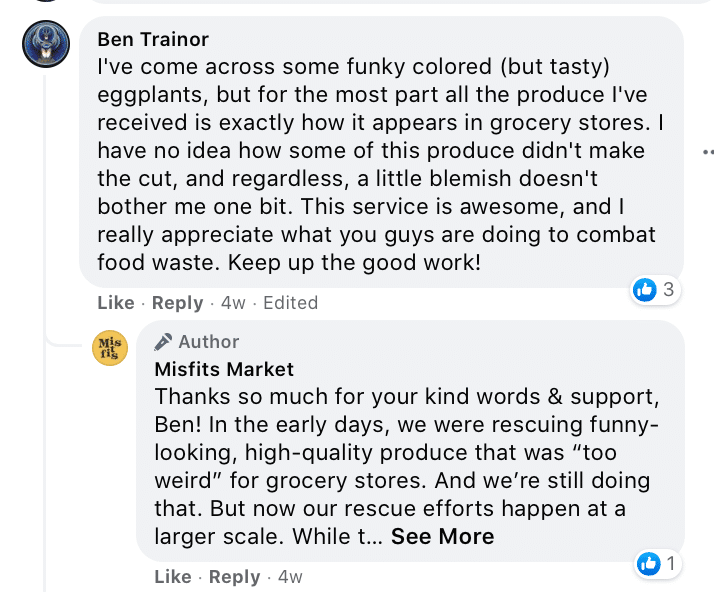
6. Responding to Complaints on Social Can Increase Customer Advocacy by 25%
It’s not uncommon for users to go straight to social media when they have an issue. The reality is that whether they’re sending you a private message or a public comment, they want a response fast.
79% of consumers want brands to respond within a day after the initial response on social media. The good news is that 71% who had a positive experience with a brand on social are likely to recommend the brand to others.
But here’s the bad news: The average brand response rate across all industries is under 25%.
How to use these social media statistics for your agency
With drastically low response rates across the board, it’s common for customers to grow frustrated and for brand advocacy opportunities to go down the toilet.
Here are some tips to consider:
Check public comments and private messages. Respond to as many as possible, but always make sure to respond to each private message. It matters.
Use a social media management tool like Agorapulse. Instead of trying to monitor multiple platforms for each client in unique places, use Agorapulse’s social inbox. You’ll get notifications each time there’s a comment or private message that needs to be addressed, and you can assign each one to a team member if needed.
7. Facebook Usage Is Dropping Among Teens, But Social Usage is Staying Consistent
Skinny jeans are out, according to Gen Z, and apparently, Facebook is, too, at least for an increasing number of teen users who are gradually leaving the platform.
Since 2015, we’ve seen usage drop from 71% of teens to 67%. That’s nothing to panic about, but it is important to take note of it.
Other platforms, on the other hand, have skyrocketing numbers for teen engagement. Agencies working with brands trying to reach this demographic should take note, investing more in platforms like Instagram and TikTok in particular.
How to use these social media statistics for your agency
Whenever you’re trying to reach younger generations, you can expect a curveball. They like to reinvent the wheel every few years.
Here’s what you can do:
Connect with influencers popular among teens for a sponsored campaign. This is a good way to get on their radar on whichever platforms they’re on.
Use their preferred platforms. If they’re on TikTok, you’d better be, too. You’ll need to learn new tricks, but it can pay off big time, especially if you’re an early adopter of the newest platforms.
Don’t try too hard. Brands who try too hard to be “hip” will have a major cringe factor. Be authentic.
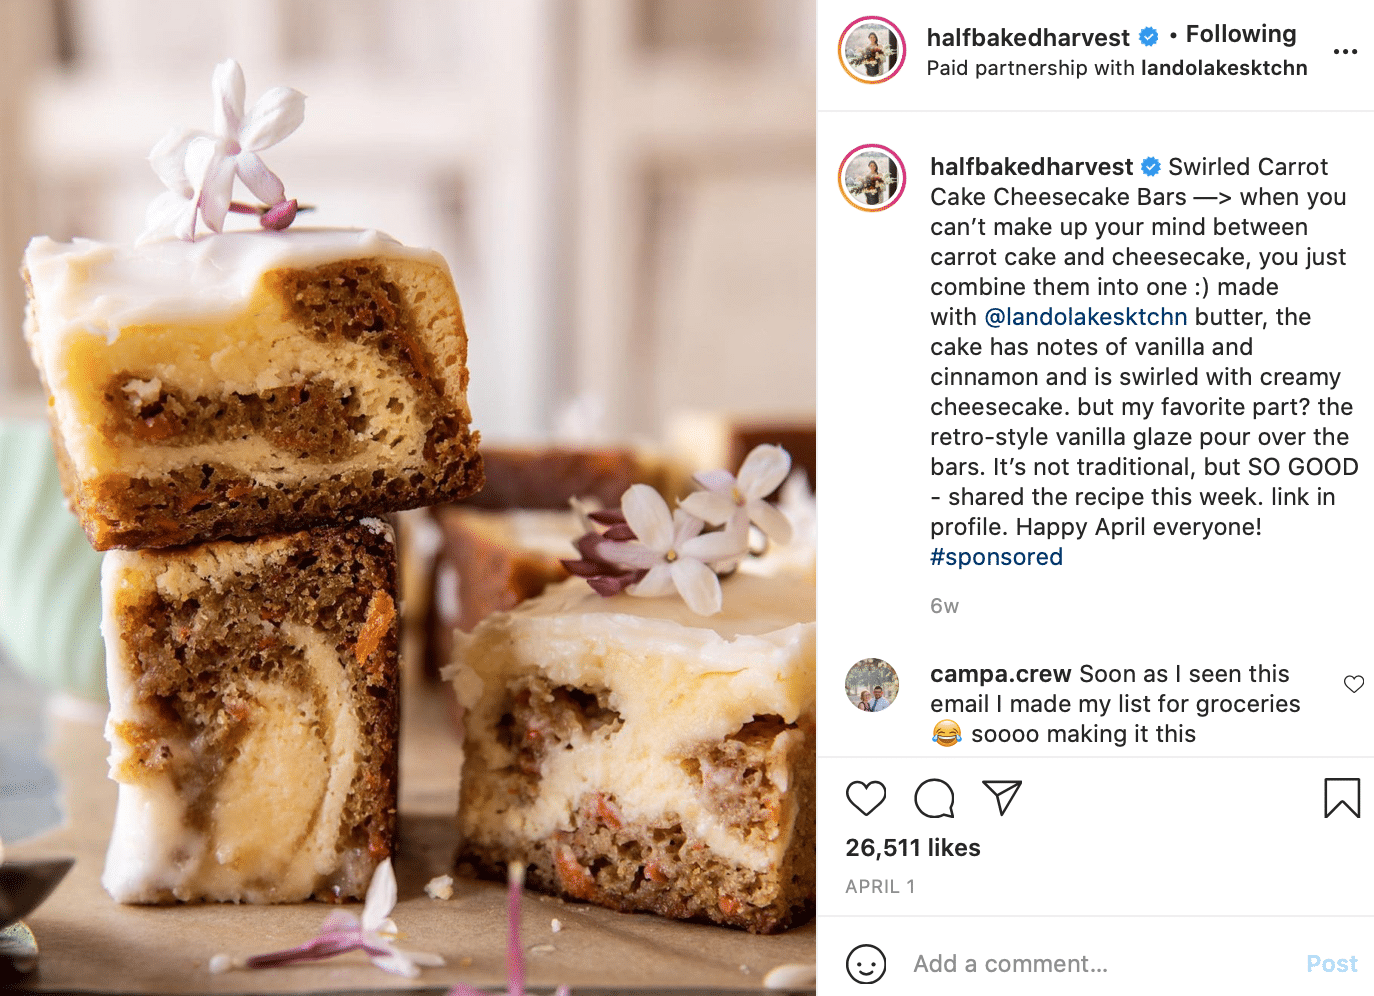
8. 49% of Consumers Follow Influencer Recommendations
Influencers are just as important on social media as ever before.
While they’re valuable across all platforms, Instagram takes the cake for the most valuable influencer platform. A total of 98% of marketers have said that Instagram is the most influential platform for influencer marketing.
How to use these social media statistics for your agency
Want to take advantage of influencer marketing? Consider the following:
Start on Instagram. Find Instagram influencers to kick off your campaign since they’re most impactful there.
Don’t discount micro-influencers. Micro-influencers have only 10-20k followers, but they’re incredibly influential for those who follow them and can be more trusted. Bonus: They’re also more affordable to work with.
Make sure you’re disclosing all sponsored partnerships. This is a requirement for all platforms.
9. 91% of Users Access Social Media On Mobile
Perhaps even more substantially, almost 80% of the total time spent on social media sites occurs on mobile platforms, often through mobile apps.
This is only expected to increase over time. Mobile accounted for over 92% of Facebook’s ad revenue in Q2 of 2020, and YouTube reaches more adults on mobile alone than any TV network.
How to use these social media statistics for your agency
Mobile matters. Here’s how you should optimize your clients’ social media marketing efforts (and your own):
Use mobile-friendly media. Think vertical images and videos that don’t require users to turn their video to view; these perform well.
Account for mobile text restrictions. On Facebook, for example, you can see more text before the “See More” prompt on desktop than on mobile. Make sure you’re considering mobile formatting when creating organic and paid creatives.
Have mobile-friendly landing pages. When you’re sending users to your site, make sure that it’s optimized for mobile.
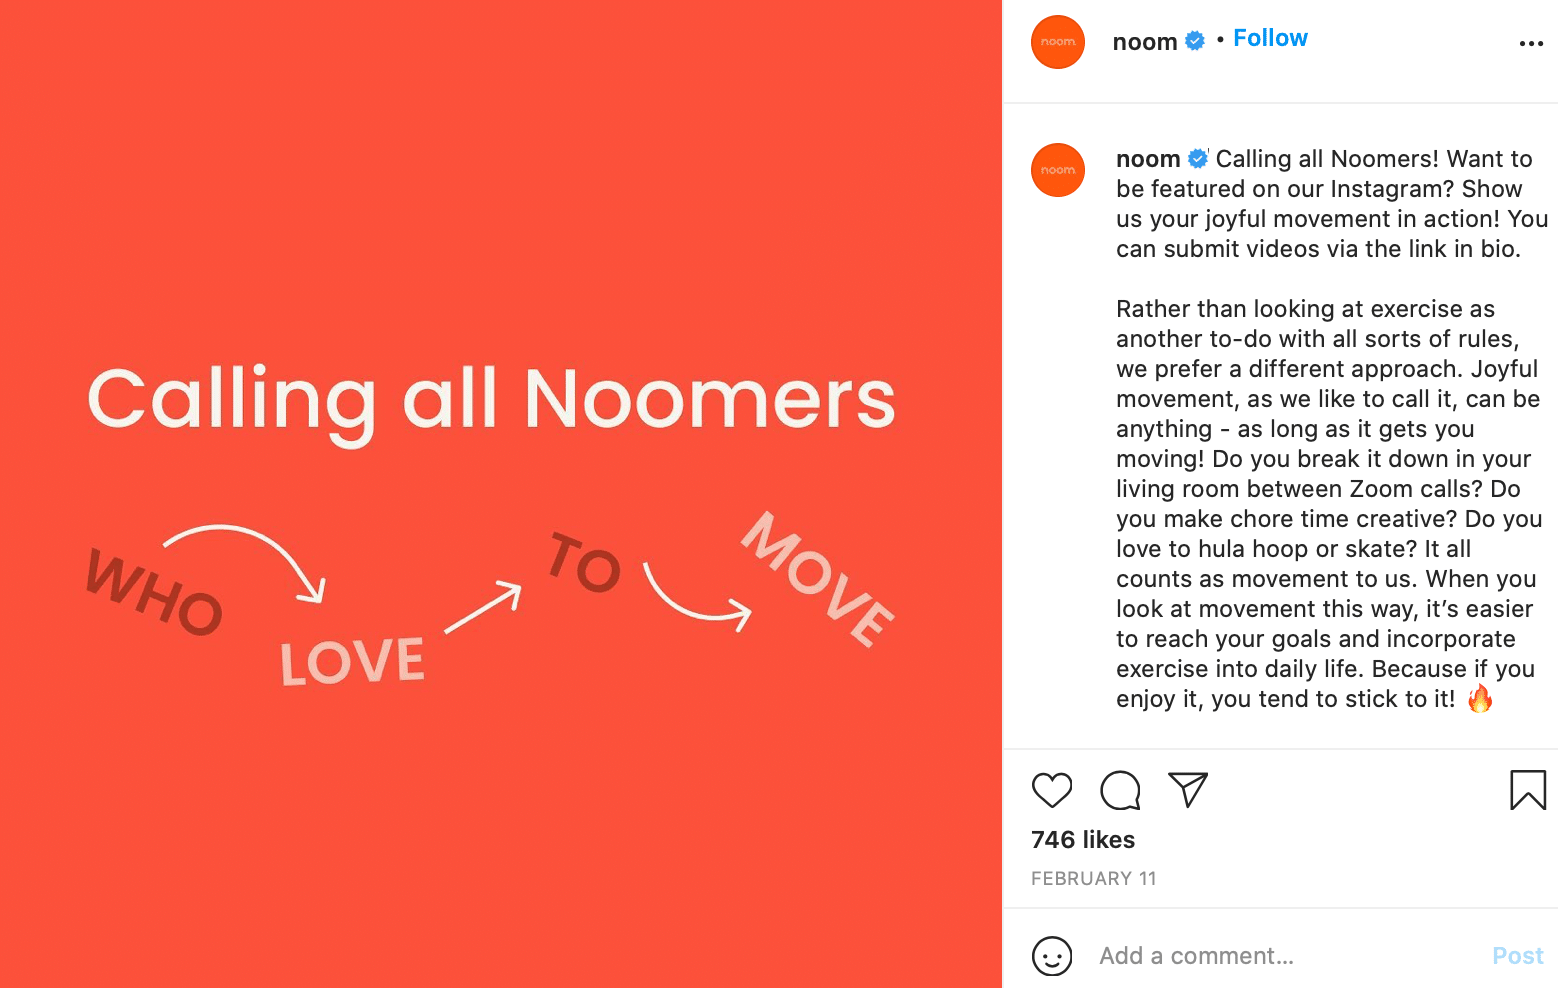
10. 79% of People Say User-Generated Content Influences Their Purchasing Decisions
This social media marketing statistic is another self-explanatory one. We’ve known for years that UGC is a powerful driving force behind building trust and encouraging purchases, and it’s just as true now as it was five years ago.
How to use these social media statistics for your agency
Here are a few tips to leverage UGC for your campaigns:
Share on-platform UGC to your Stories. It’s a great way to promote existing UGC and show other users that they can be featured by their brand if they join in on the fun, too.
Include CTAs in posts and in your bios to encourage UGC. When you tell users what kind of content you want them to create and how to get it in front of you, they’re much more likely to follow suit.
Start a branded hashtag and ask users to tag you. This is an easy way to find UGC that’s already being created. Let people know you want to see it!
11. Facebook Is Still the Most-Used Social Platform Worldwide
While so many people have publicly declared that they’ll be deleting their Facebooks amidst privacy concerns or the youth declaring it “cheugy,” the reality is that Facebook is still the dominating platform online.
Facebook has over 2.7 billion monthly active users, (as of this article’s publication) which blows away all the competition. Never count this platform out, even with declined organic reach. It has held on for over a decade as the top social networking site.
How to use these social media statistics for your agency
The biggest tip we have here is to still invest time and effort on your Facebook. It’s commonly used to discover brands, and you want to be active there. Short and simple, but it’s a good reminder for agencies who have started to focus less on Facebook overall.
hbspt.forms.create({
region: “na1”,
portalId: “8477337”,
formId: “e8749a20-cfed-4e1d-9d89-c045476699fb”
});
12. Social Ad Spending in the US Is Expected to Rise by 21.3% in 2021
This will take the total ad spend to over 49 billion USD by the end of this year, which is pretty astonishing. Facebook and Instagram Ads dominate with the largest share of paid social revenue, but all other platforms hold their own, too.

How to use these social media statistics for your agency
This information should offer the following insights:
Social media ad platforms may become more competitive, which could drive up costs in certain circumstances.
Your clients are likely going to be more willing to invest in paid social ads.
Consider looking for high-value platforms that your audience responds to, like TikTok ads for the younger generations or Promoted Pins for DIY content.
In Conclusion
These 12 social media marketing statistics for businesses and agencies are excellent points of reference for how you should prioritize your efforts moving forward.
Each one is actionable, giving us crucial information and new insights on the best way to reach our target audience.
Take control of your social media! Check out our free trial of Agorapulse to help you schedule, track, and measure all your social media efforts.
Read more: agorapulse.com


